Fig. 3.
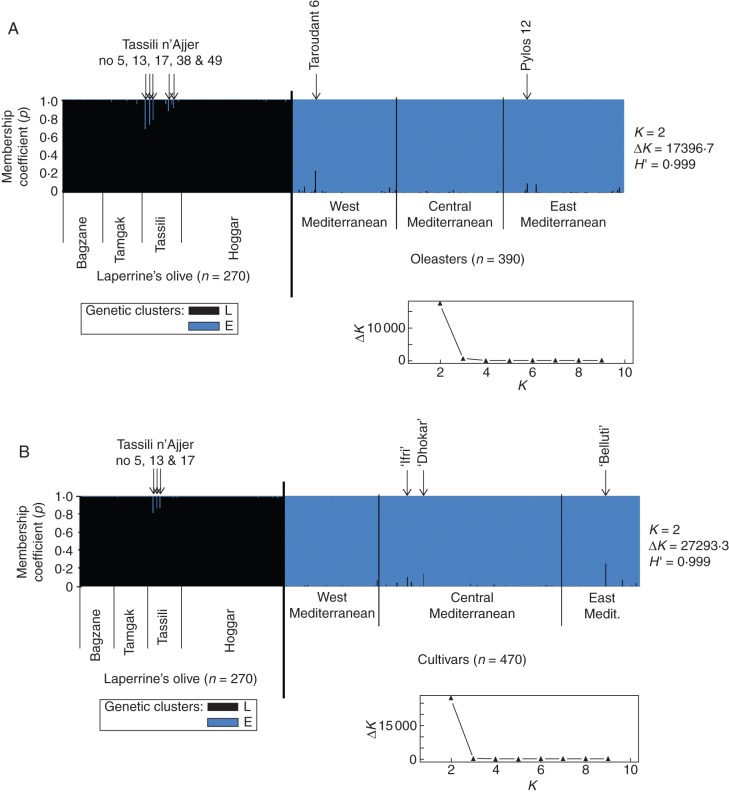
Inference of population structure based on ten nuclear SSRs using model-based Bayesian clustering implemented in STRUCTURE (Pritchard et al., 2000) for two pairwise comparisons: (A) Laperrine's olive–oleasters (660 individuals); and (B) Laperrine's olive–cultivars (740 individuals). Each vertical bar represents an individual. The membership coefficients of assignment (p) of each individual to the different clusters averaged over ten iterations is shown for K = 2 clusters (but see Supplementary Data Fig. S3 for K = 3 or 4). H′ represents the similarity coefficient between ten runs for each K, and ΔK is the ad-hoc measure of Evanno et al. (2005). The graph on the bottom right gives ΔK plotted against K. Most accessions of subspecies laperrinei and europaea are assigned to clusters L and E, respectively. The putative admixed individuals (p >0·1) are indicated by arrows.

