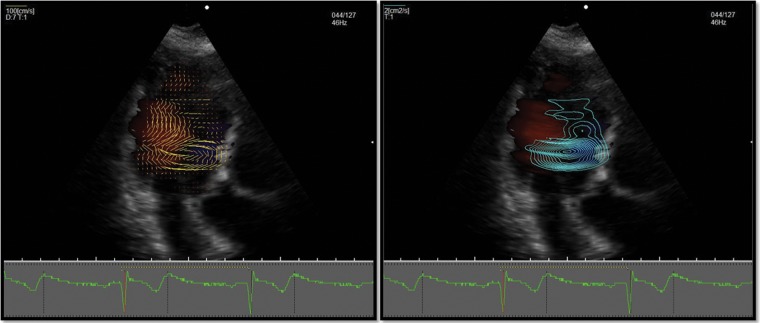
Figure 3.
VFM provides two main visualization modes: (i) On the left, vector display shows the direction and intensity of flow velocity in each point of the scanned area through yellow arrows proportional in length to flow velocity. (ii) On the right, vortex visualization mode displays round lines indicating the presence of a vortex, with higher line density corresponding to areas of more intense flow. Both vector and vortex scale and density can be adjusted by the user.

