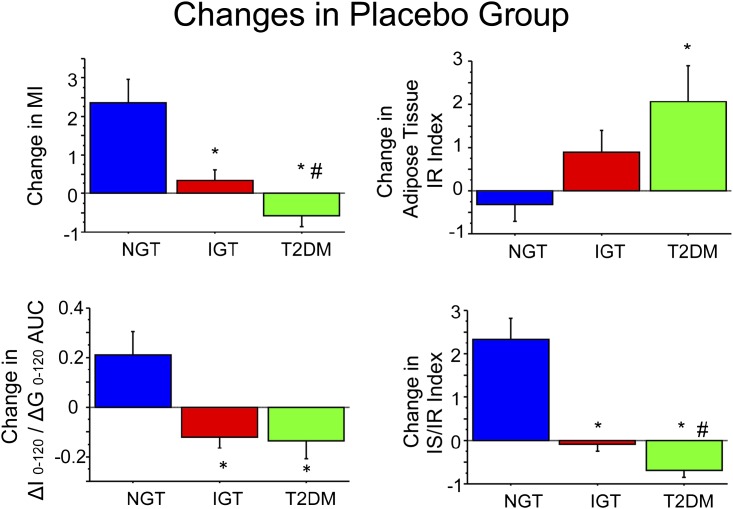
FIG. 2.
Change in MI (top left), IS (ΔI0–120/ΔG0–120) (bottom left), IS/IR index (bottom right), and adipose tissue IR index (top right) in placebo-treated subjects. Data are given as means ± SE. Change represents the difference between the absolute value at the study end minus baseline value. *P < 0.05 for NGT vs. IGT or T2DM; #P < 0.05 for IGT vs. T2DM using nonparametric tests.

