
FIG. 2.
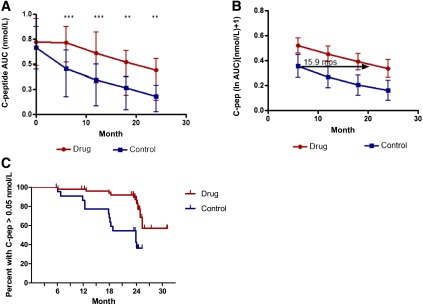
C-peptide (C-pep) responses in drug-treated and control subjects. A: The mean ± 25th and 75th percentiles of the C-pep AUC (nanomoles per liter) are shown for the drug and control groups (***P = 0.002; **P < 0.02, ANCOVA for each time point). B: Estimates and 95% CIs from a mixed effects model, with fixed effects for treatment group and linear and quadratic trends over time and random subject-level effects for intercepts and linear trends over time. Drug-treated subjects are estimated to have a delay of decline in C-pep by 15.9 months (i.e., would reach control 6-month values 21.9 months after study entry). C: Proportion of subjects with detectable C-pep (i.e., >0.05 nmol/L). The actual study dates when the MMTTs were performed are shown. There was a significantly greater loss of detectable C-pep secretion in the control group at month 24 (P = 0.002, χ2 test).