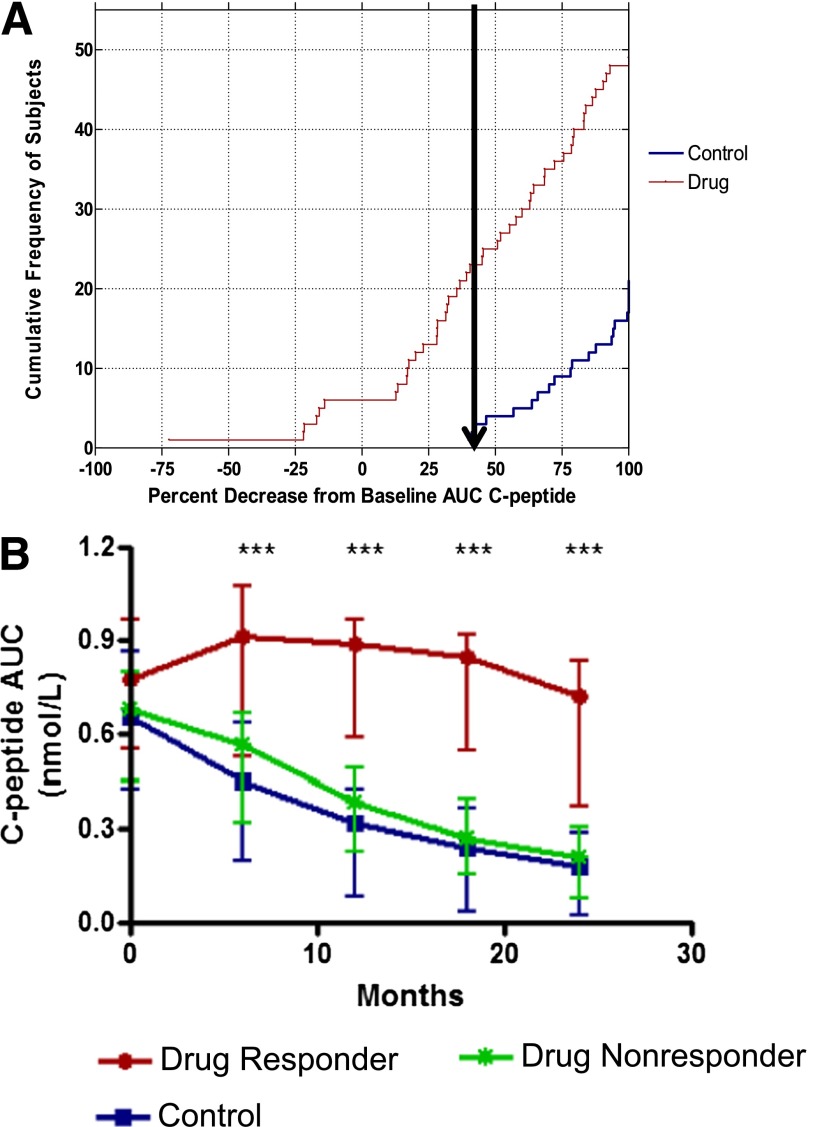
FIG. 4.
Identification of clinical responders to teplizumab. A: The cumulative frequency of subjects and distribution of percentage decrease from baseline C-peptide AUC at month 24. The arrow shows the smallest percentage loss of C-peptide AUC in the control group. B: The C-peptide AUC at each time point (means ± 25th and 75th percentiles) is shown for the responders (red line) and nonresponders (green line) in the drug-treated group and for the control subjects (blue line). ***P < 0.001 between responders and nonresponders at each time point based on ANCOVAs.

