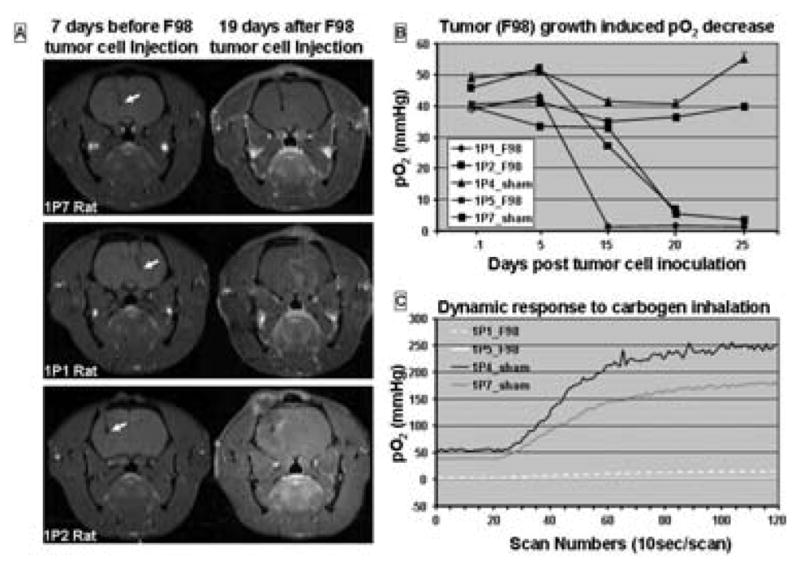
Figure 4.

pO2 in rat F98 brain tumor measured with a single probe resonator. A: MRI images before and 19 days after F98 inoculation. Arrows indicate the probe locations in the brain. B: pO2 measured the day before, 5, 15, 20 and 25 days after F98 inoculation in 3 rats with tumors and 2 rats with sham injections. C: Carbogen challenge at day 25 after baseline 30% pO2.
