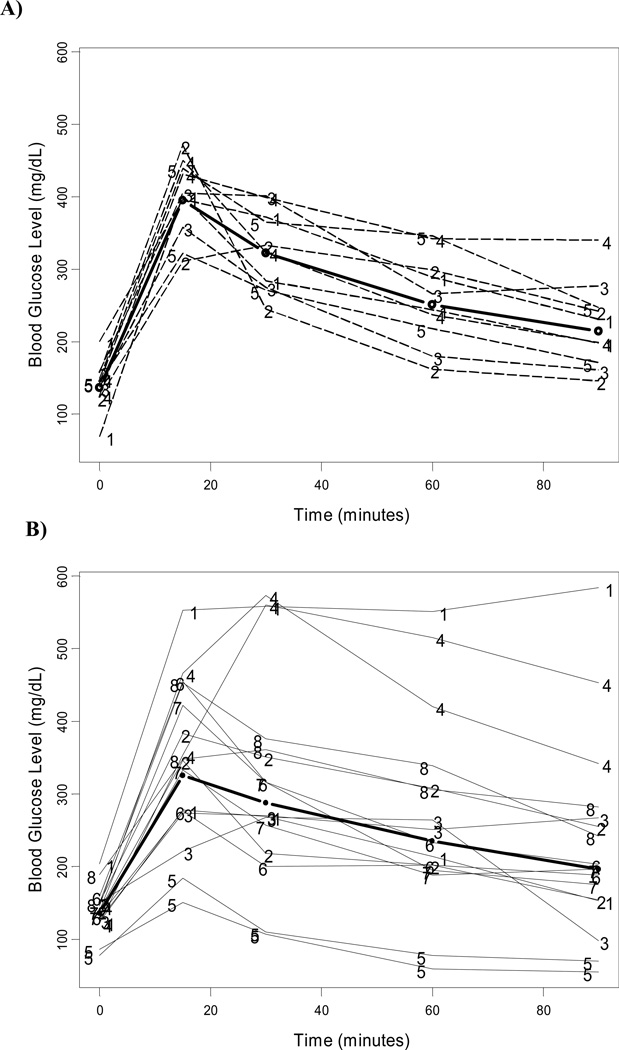
Figure 1. Greater variance in glucose tolerance tests for HCV core transgenic compared to non-transgenic controls.
Plot of individual and mean (thicker line) with 95% confidence interval glucose tolerance testing profiles in non-transgenic (A) and HCV core transgenic mice (B). Numbers represent mouse identification at each trial.

