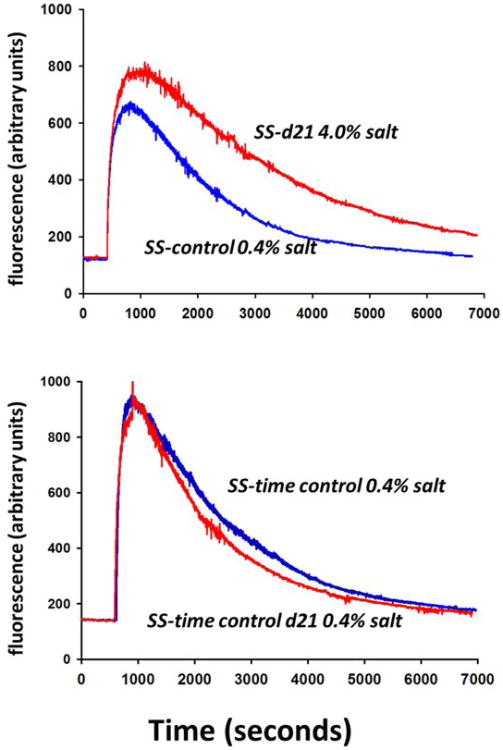
Figure 1.
Excretion kinetics for FITC-sinistrin in a representative SS rat from each group studied. Upper panel shows the measurement in an SS rat obtained on the last control day on 0.4% (blue line) and the measurement in the same SS rat on day 21 (d21) of 4.0% salt diet (high salt; red line). Lower panel shows the measurement in a SS rat from the time control group on the same days but with the animal maintained on 0.4% salt for the duration of the study.

