
Figure 5.
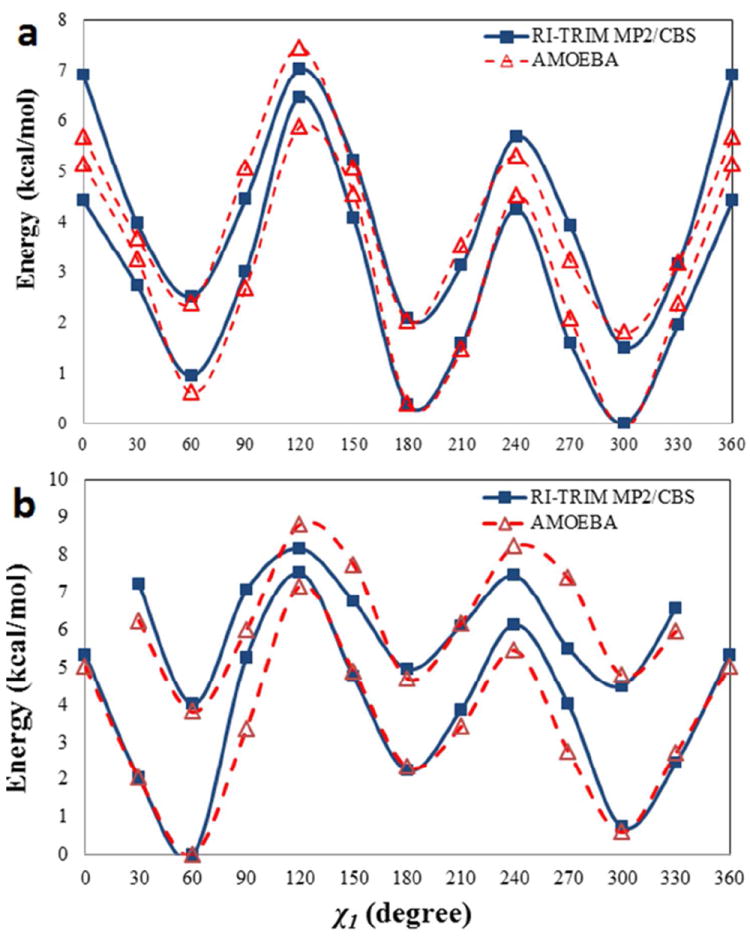
Comparison of (a) isoleucine and (b) serine conformational energy about χ1 angle. The solid lines are RI-TRIM MP2/CBS energy while the dashed lines are AMOEBA values. The AMOEBA curve is shifted to minimize the overall RMS difference between AMOEBA and QM. The top set of curves (with higher energy at 0 degree) corresponds to a backbone conformation of (-60.0, -45.0), and the other corresponds to (-140.0, 135.0).