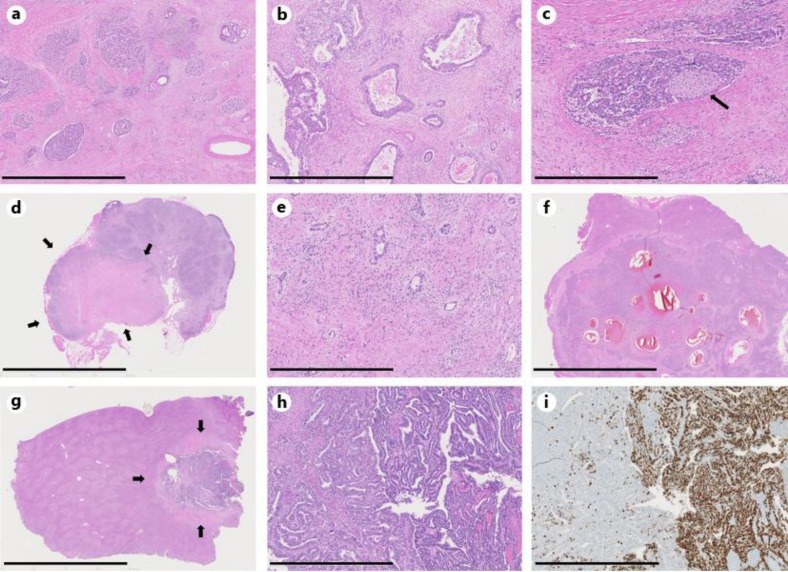
Fig. 2.
Histopathological findings of pancreas and liver resection specimens. a Overview of the pancreas; resection after chemotherapy. The tumor shows both acinar cell differentiation (left) and ductal differentiation (right), as well as regressive changes (scale bar = 2 mm). b High-power view of the former picture (scale bar = 1 mm). c Perineural infiltration by the acinar cell tumor component. The arrow points to the peripheral nerve (scale bar = 0.8 mm). d Mostly regressive perihilar lymph node metastasis (arrows); resection after chemotherapy (scale bar = 10 mm). e High-power view of the former picture showing few ductal differentiated vital tumor deposits in a regressive background (scale bar = 0.5 mm). f Overview of a liver metastasis with cystic regressive areas with hemorrhage; resection after chemotherapy (scale bar = 10 mm). g Overview of another liver metastasis (arrows); resection after chemotherapy (scale bar = 10 mm). h High-power view of the former picture shows a tumor with blastomatous features (scale bar = 1 mm). i MIB-1 staining reveals a high-proliferation rate of the blastomatous tumor component (scale bar = 0.9 mm).

