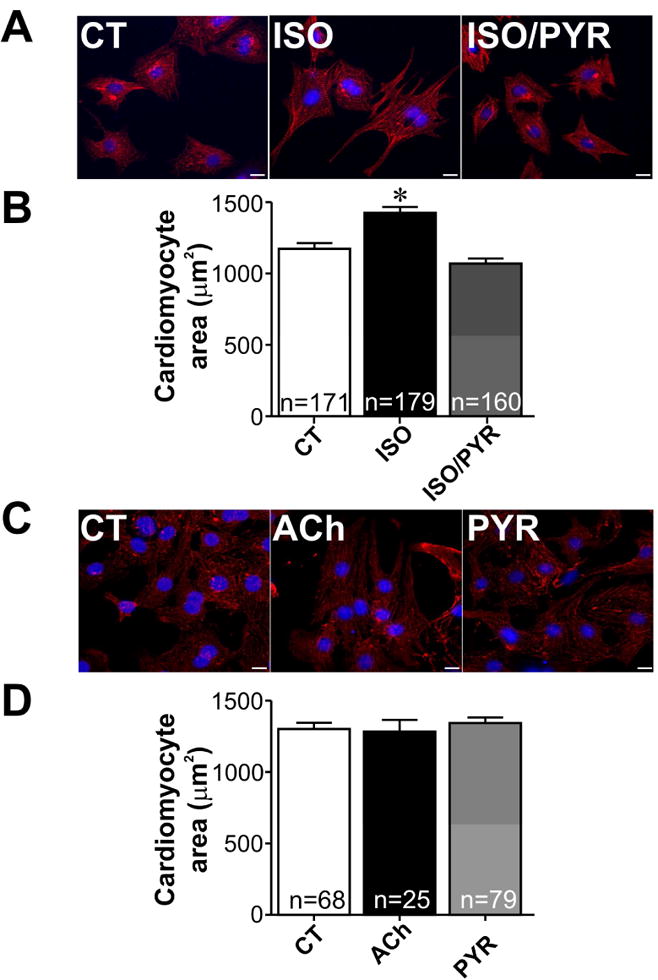
Figure 3. Cholinesterase inhibition suppresses hypertrophy induced by isoproterenol in rat neonatal cardiomyocytes.

A. Representative immunofluorescence images from α-actinin/DAPI stained neonatal cardiomyocytes in control (CT), isoproterenol (ISO) and isoproterenol/pyridostigmine (ISO/PYR) treated groups. B. Quantification of cardiomyocyte surface area from experiments shown in A. C-D. Representative immunofluorescence images and quantification of cellular surface area from α-actinin/DAPI stained neonatal cardiomyocytes from CT, ACh and PYR treated groups. *p<0.05 when compared to control and ISO/PYR groups. n= number of cells analysed in each group. Scale bar=10 μm.
