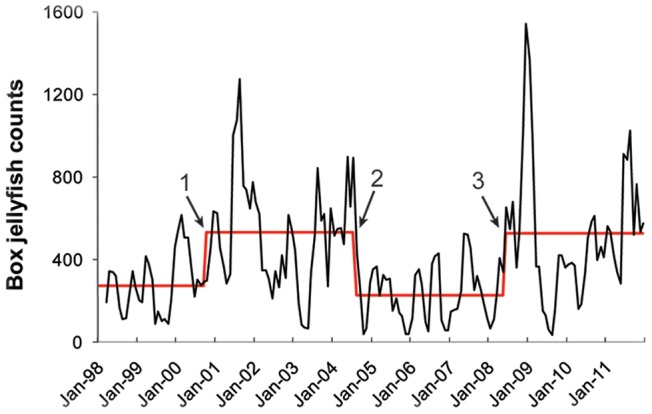
Figure 3. Monthly time-series of box jellyfish counts at Waikiki Beach.

A three-month moving average smoothing approach was used to enhance visualization of the trend, depicted by the solid back line. The solid red line indicates mean box jellyfish beach counts during periods of no significant change determined by the Change Point Analysis (CPA). Three significant regime shifts in jellyfish numbers occurred during the 14-year period of study, corresponding to the periods previously identified by the GAM analysis: 1) 2000, 2) 2004, and 3) 2008. Dataset had no zeroes.
