
Figure 1. Analysis strategy.
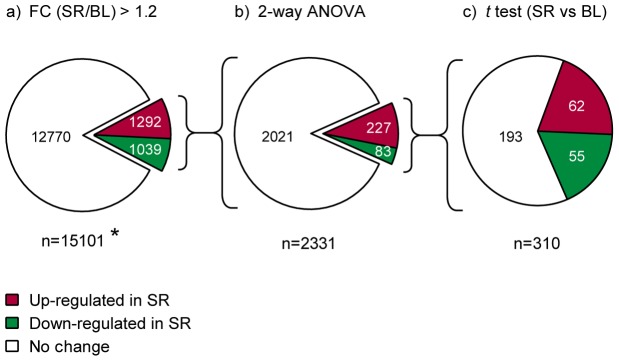
The flow of statistical analysis and the amount of entities (genes/transcripts) after each step are illustrated. a) The 15101 entities that passed the filtering by flags and reannotation included 1292 up-regulated (red) and 1039 down-regulated (green) transcripts with at least 1.2-fold change from baseline (BL) to sleep restriction (SR) in sleep-restricted subjects ( = cases). * The pathway analysis was run for these genes. b) The 2331 entities were analyzed with 2-way ANOVA using the case/control status and the three timepoints as analysis axes. Changes with ANOVA interaction P value <0.05 were observed in 227 up-regulated and 83 down-regulated transcripts. c) Altogether 310 entities were further analyzed with 1-way repeated measures ANOVA considering the three timepoints. The 43 entities showing changes also in the control group were excluded from the analysis. The 133 genes with 1-way ANOVA P value <0.05 for the cases but not for the controls were then analyzed using a t test between the timepoints BL and SR. 62 genes were up-regulated and 55 down-regulated (P<0.05).