
Figure 3. Shared species at subject-level (Figure 3A) and ethnicity-level (Figure 3B).
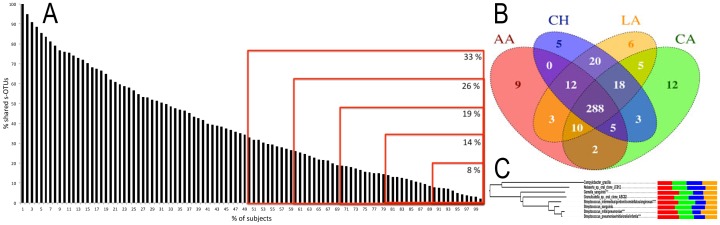
2% of s-OTUs were shared by all individuals, 8% of s-OTUs were shared by 90% of individuals and over a third of the s-OTUs were shared by 50% of the subjects, supporting the existence of a core microbiome at both levels. Figure 3C shows relative abundances of species shared by all individuals. Abundances of 4 shared species were different between ethnicities (p<0.001, ANOVA on transformed variable).