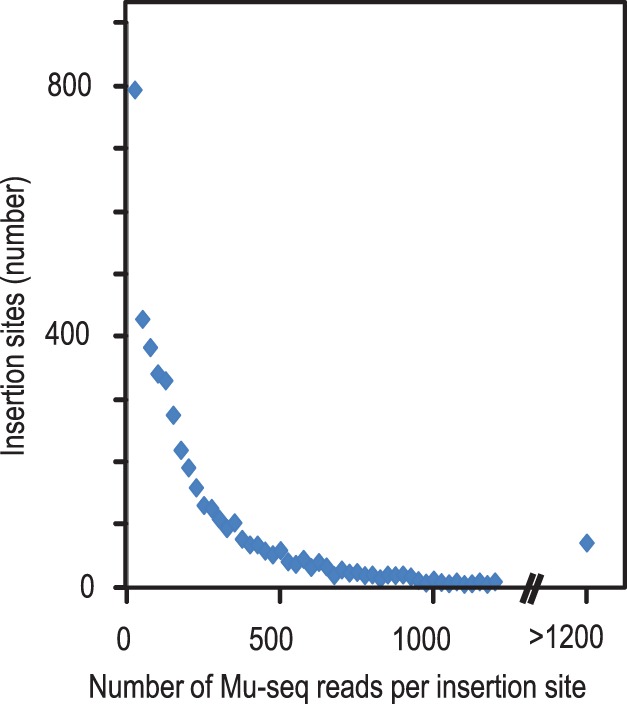
Figure 7. Numbers of Mu-seq reads per insertion site detected in a multiplex library.

The number of reads per insertion site in the Mu-seq dataset described in Table 1 varied over 877-fold and showed an approximately exponential distribution. Because a portion of the insertions would be segregating in the four plants sampled for each family, variation in copy number can account for up to 8-fold difference; i.e. 8 copies if all four plants are homozygous for the insertion compared to 1 copy if the insertion is present in a single heterozygote. The remaining ∼110-fold range in read counts is attributed to differences in PCR amplification efficiencies of TIR-variants and flanking genome sequences (see text).
