
Figure 3. Voltage changes in response to ultrasound are caused by changes in bilayer capacitance.
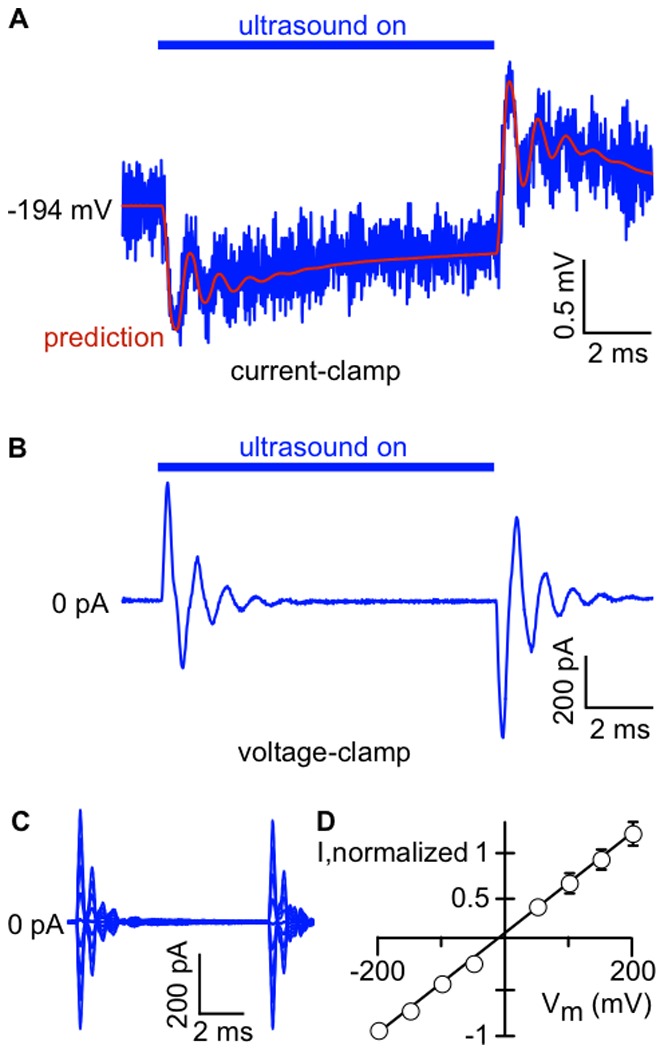
A.Voltage changes recorded under “current-clamp”. A 10-ms ultrasound pulse at 1 MHz and 610 mW/cm2 was applied to a POPE/POPG (3∶1) bilayer charged to −194 mV (blue line). The red line shows the voltage changes predicted from the current recorded in voltage-clamp mode (panel B), calculated using Eq. 3. The voltage trace is the average of 20 ultrasound applications. The capacitance of the bilayer was 110 pF. B. Current recorded from the bilayer in A under voltage-clamp at −200 mV, in response to the same ultrasound stimulus as in A. The current trace is the average of 20 ultrasound applications. C. Currents in response to a 10-ms, 1-MHz, 610-mW/cm2 ultrasound application in a POPE/POPG (3∶1) bilayer voltage-clamped at potentials from −200 mV to +200 mV, in 50-mV steps. Current traces are the average of 20 ultrasound applications. The capacitance of the bilayer was 130 pF. D. Mean (± SE) peak negative or positive current following the end of the ultrasound stimulus, as a function of bilayer voltage, normalized to the peak negative current at −200 mV (n = 5). Some error bars are smaller than the symbol size. The black line is a linear fit with slope 5.5±0.1 mV−1 and y-intercept 0.05±0.01 (± SD).