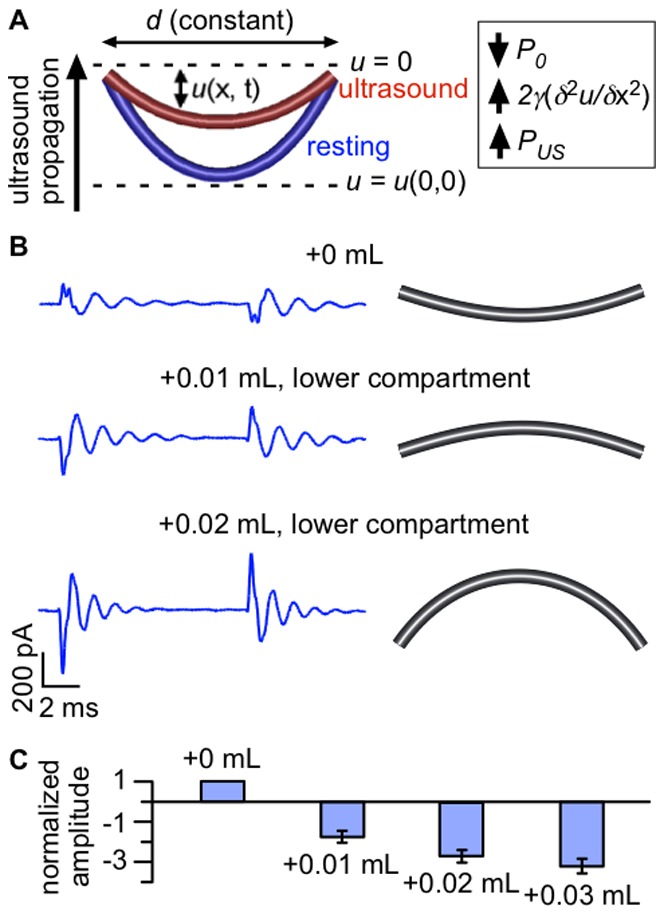
Figure 5. The response to ultrasound depends on bilayer curvature.

A. Diagram illustrating changes in bilayer shape in response to ultrasound. The bilayer is a curved surface (shown in cross-section) with base of diameter d. The bilayer displacement u(x, t) is measured relative to the plane u = 0, with positive displacement defined to be in the direction of ultrasound propagation. Under standard experimental conditions, the bilayer is curved opposite the direction of ultrasound propagation in the resting state (blue). In response to ultrasonic radiation force, bilayer curvature is decreased (radius of curvature increased) and bilayer area is decreased (red). The inset summarizes the three types of pressure that determine the bilayer curvature at steady-state: the hydrostatic pressure, P0 (negative); the pressure due to bilayer tension, 2γ(δ2u/δx2) (positive); and the pressure due to radiation force, PUS (positive). The changes in response to ultrasound are exaggerated for the purpose of illustration. B. Capacitive currents at −200 mV in response to a 1-MHz, 610-mW/cm2 ultrasound pulse with different solution volumes in the lower compartment of the bilayer chamber (left), along with illustrations of the inferred resting-state bilayer curvature (right). The lower compartment volumes are 0.45 mL (+0 mL, top), 0.46 mL (+0.01 mL, middle), and 0.47 mL (+0.02 mL, bottom). Currents are the average of 10 ultrasound applications and the baseline currents are subtracted. Bilayer capacitance was 170 pF. C. Mean (±SE) amplitudes for fits of Eq. 1 to the Off capacitive current at −200 mV in response to ultrasound at 1 MHz and 610 mW/cm2 with different solution volumes in the lower compartment of the bilayer chamber, normalized to the amplitude at the initial volume and to bilayer capacitance (see Materials and Methods, “Data Analysis” section) (n = 11–15).
