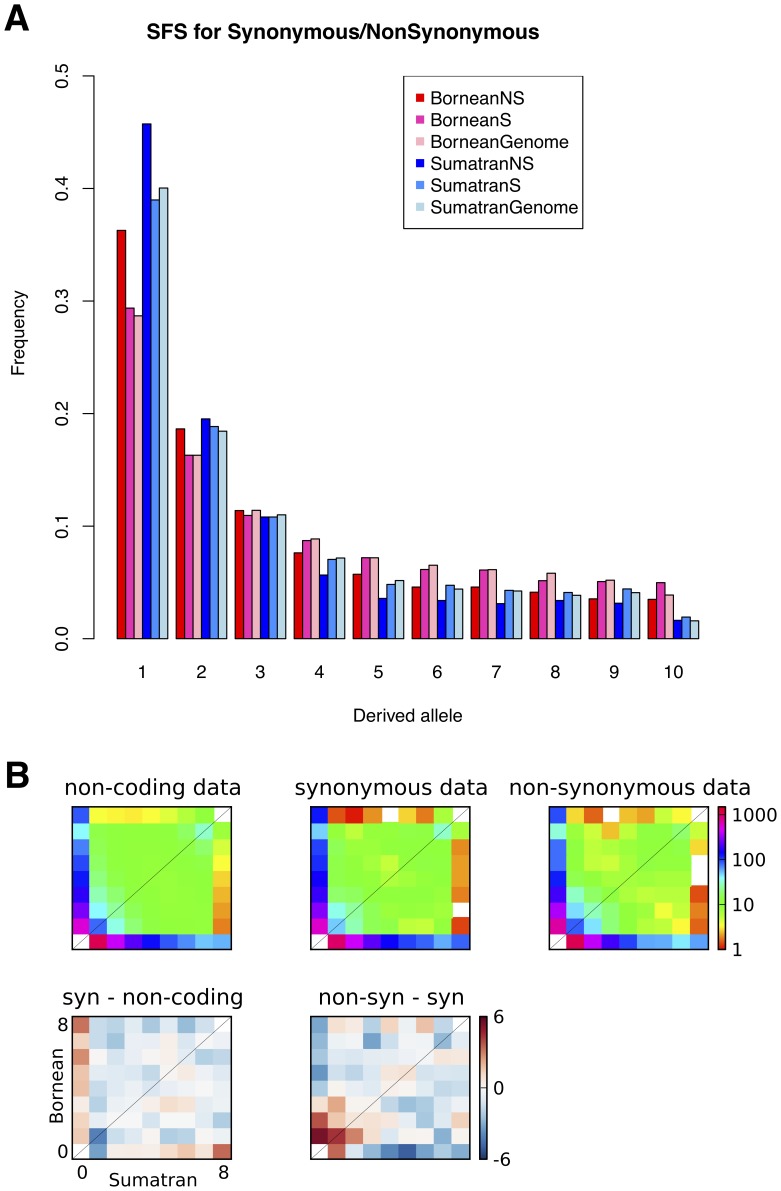
Figure 2. SFS analysis.
(A) SFS for all genomic SNPs (Genome), synonymous (S) or non-synonymous (NS) SNPs in Bornean (Red) and Sumatran (Blue) population. (B) Two-dimensional SFS (Bornean on Y axis and Sumatran on X axis). Top row: Spectra for different functional categories of SNPs. To make all the spectra directly comparable, the non-coding and synonymous spectra have been re-scaled to represent the same number of segregating SNPs as the non-synonymous spectrum. Bottom row: residuals between pairs of spectra. Bottom-left compares synonymous and non-coding spectra, and bottom-right compares non-synonymous and synonymous spectra. Red and blue entries indicate, respectively, that the first spectrum has greater or fewer SNPs in that entry than the second.

