
Figure 3. FDG-PET-CT activity of different tissue types upon VNS intervention.
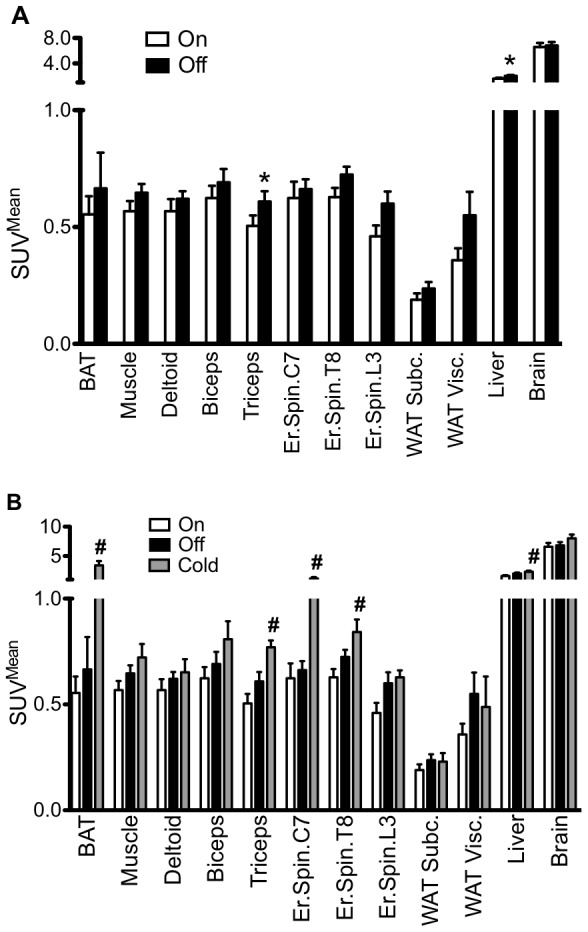
SUVMean values for Brown Adipose Tissue (BAT), all muscle (Muscle), deltoid muscle (Deltoid), biceps muscle (Biceps), triceps muscle (Triceps), erector spinae muscle at the level of vertebrae C7 (C7), T8 (T8), L3 (L3), subcutaneous white adipose tissue (WAT Sc), visceral white adipose tissue (WAT Visc), the liver (Liver) and the brain at the level of the cerebellum (Brain). A. Comparison of activity during VNS-On and VNS-Off. B. Comparison of activity between VNS-On, VNS-Off and VNS-Cold. Values shown are mean + S.E.M. * P<0.05 for paired t-tests between VNS-On and VNS-Off. # P<0.05 for one-way ANOVA with post-hoc Bonferroni correction between VNS-On, VNS-Off and VNS-Cold.