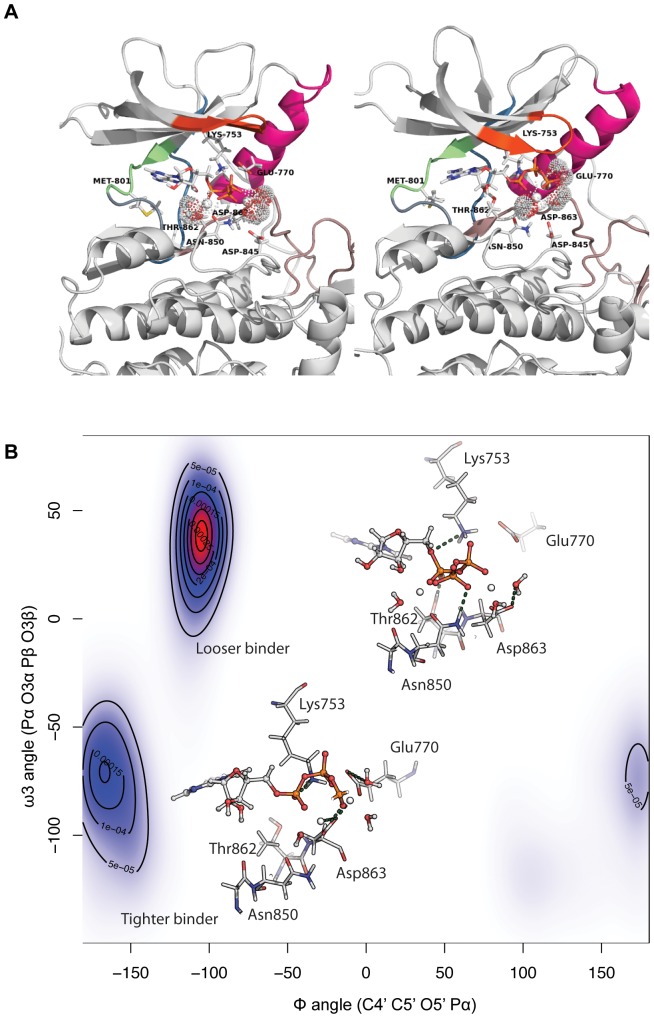
Figure 5. Different binding modes for ErbB2 bound to ATP.
(A) Global kinase conformation for the looser (picture on the left) and the tighter (picture of right) binding modes. The color scheme is the same that described in Figure 4A) Two dimensional plot of the Φ and ω3 angles of ATP, where isolines represent the 2D kernel density estimation as calculated using an axis-aligned bivariate normal kernel evaluated on a square grid. Different rotameric states of ATP lead to a different interaction profile with neighbouring residues in the pocket.

