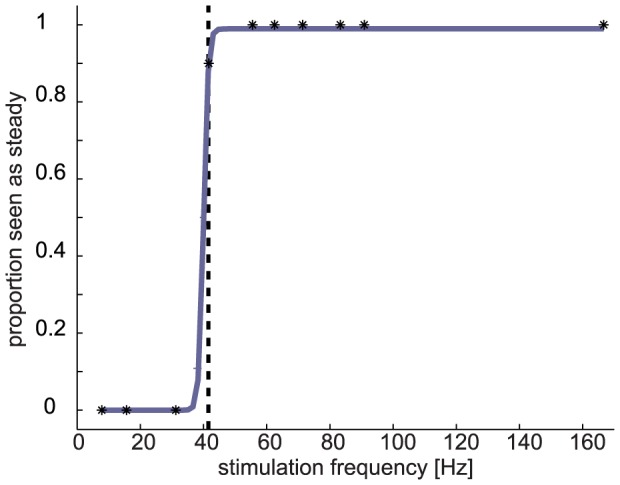
Figure 3. Subjective Flicker Perception.

Psychometric function as determined in phase II, describing the relation between stimulation frequency and flicker perception (for the same participant as in Figure 2). The dashed vertical line shows the 90% threshold of the curve, at which the stimulus was reported to be “steady” in 90% of trials. This frequency was taken as the flicker fusion threshold.
