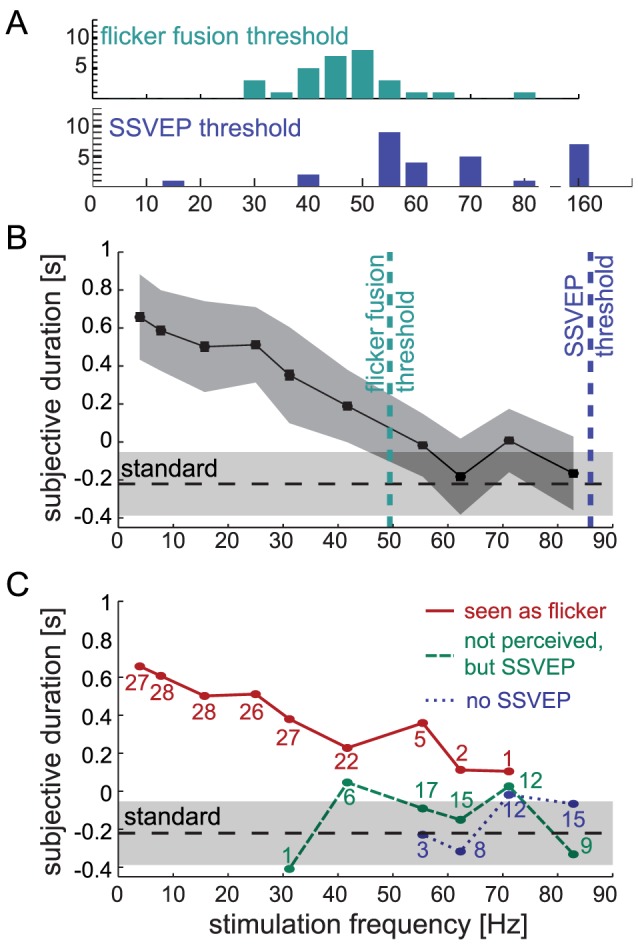
Figure 4. Perceived Duration.

A: Histogram of individual flicker fusion thresholds (green) and SSVEP thresholds (blue) as determined in phases I and II of the experiment. B: Average perceived duration for all stimulation frequencies (positive values on the y-axis indicate over-estimation, negative values indicate under-estimation). The dark gray area indicates 95% confidence intervals. The dashed horizontal line shows the threshold estimated for the reference frequency (165.7 Hz) against which all other frequencies were compared (the light gray shade indicates 95% confidence interval). Frequencies up to 41.7 Hz were significantly perceived as longer than the standard. Vertical lines show the flicker fusion threshold (cyan) and the SSVEP threshold (blue) averaged across participants. C: Same data as in B, shown separately for stimuli perceived as flicker, not perceived as flicker but evoking an SSVEP, and no SSVEP. The duration of stimuli perceived as flicker (red) was overestimated compared to the reference frequency, for frequencies up to 31.4 Hz (all p<0.05), resulting in a linear relationship between flicker frequency and perceived duration. Flicker frequencies that were not perceived as flicker but evoked a frequency-specific SSVEP (green), and frequencies that were neither perceived nor evoked a SSVEP (blue) were not perceived as longer than the reference frequency. The numbers next to the data points indicate the number of participants contributing to this data point (if they do not add up to 30, this is because of excluded outliers).
