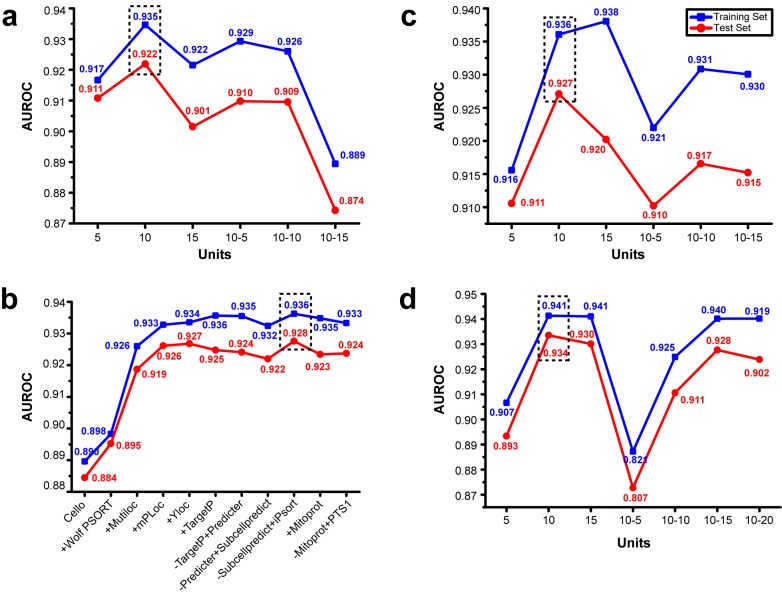
Figure 2. Determination of the model topological structure.
(a) Performance under different model structures with full data as input. Blue lines denote the training set and red lines denote the test set. Peak for prediction was on 10 neurons, 1 hidden layer. (b) Stepwise-selection performance was evaluated by AUROC. Obvious enhancement took place in step 2, 3 and 4. Peak was in step 9, with best community consisting of cello, Wolf PSORT, MultiLoc, mPloc, YLoc and iPsort. (c) With selected community of predictors, model topological structure was determined using the same method in (a). Peak was on 10 neurons, 1 hidden layer. (d) Model structure evaluation for combination of group-voting and neural network. Results from group-voting were taken as input for neural network. Peak was on 10 neurons, 1 hidden layer. The best results are boxed in dash.

