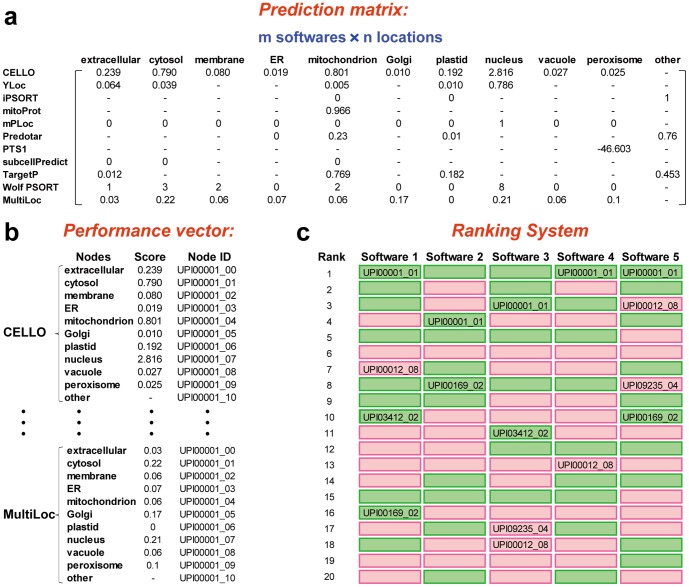
Figure 4. Model for group voting.
(a) Raw prediction results from 11 predictors were arranged in a performance matrix for a given protein sequence. For subcellular locations that could not be predicted by a specified predictor, a short line presented the absence. (b) Performance vector of predictors was obtained from the performance matrices of different sequences. Each node corresponds to a subcellular location with a score from predictor and an id consisting of protein id and subcellular location code. (c) Ranking system was established according to performance vectors. For each predictor, a rank list was given according to the scores ranging from high to low in performance vectors.

