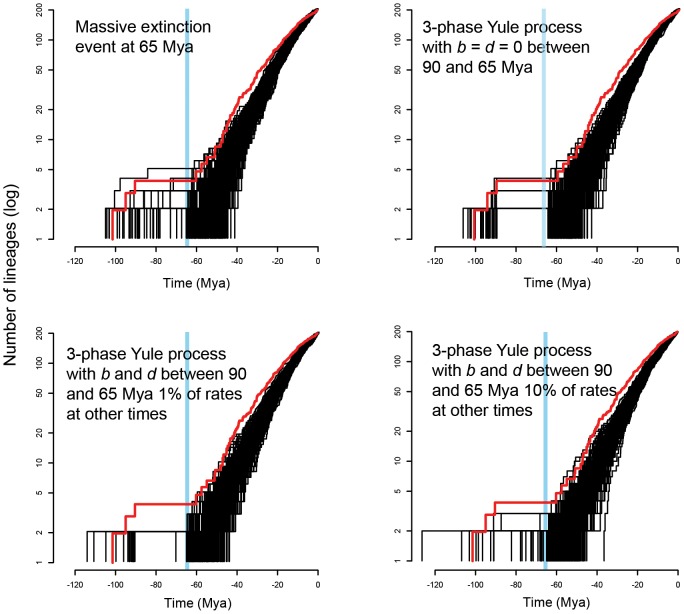
Figure 3. LTT plots for TreeSim simulations of a massive extinction event and three scenarios involving a 3-phase process where birth/death (λ/μ) values vary over time.
Simulations specified 1000 actual extant taxa, pruned to 200 taxa to represent incomplete taxon sampling. (a) A massive extinction event at 65 Mya where λ = 0.2, μ = 0.1, and 92% of lineages go extinct at 65 Mya. (b) A 3-phase Yule process where λ = 0.2, μ = 0.1 prior to 65 Mya, λ = 0.0, μ = 0.0 between 90 and 65 Mya and where λ = 0.2, μ = 0.1 after 65 Mya. (c) A 3-phase Yule process where λ = 0.2, μ = 0.1 prior to 65 Mya, λ = 0.02, μ = 0.01 between 90 and 65 Mya and where λ = 0.2, μ = 0.1 after 65 Mya. (d) A 3-phase Yule process where λ = 0.2, μ = 0.1 prior to 65 Mya, λ = 0.002, μ = 0.001 between 90 and 65 Mya and where λ = 0.2, μ = 0.1 after 65 Mya. The red lines show the empirical LTT plots from Figure 2 based on the maximum credibility BEAST tree.

