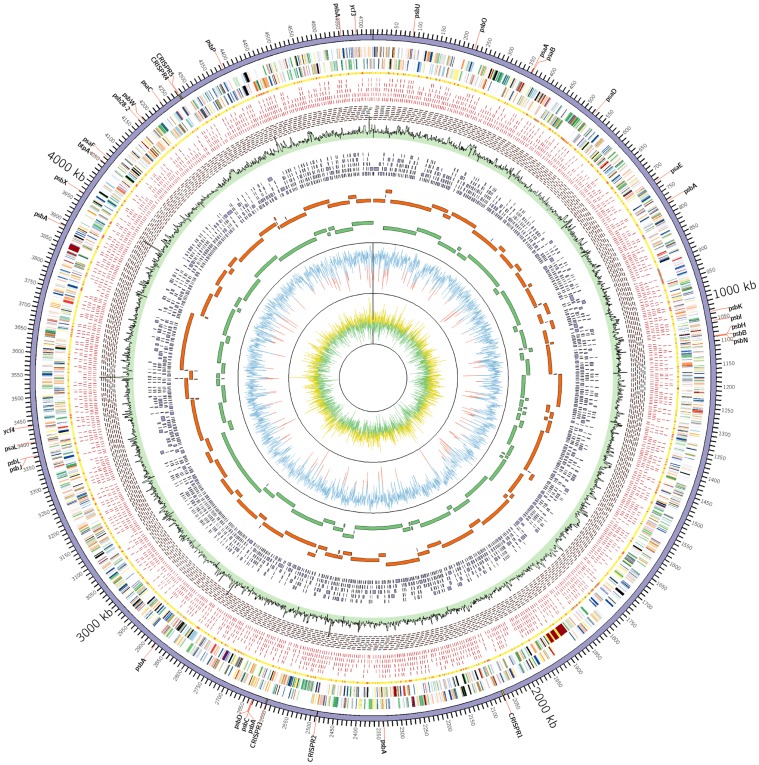
Figure 2. Circular representation of the Gloeobacter kilaueensis JS1T genome.
From inside out: GC skew (Yellow>0, Green<0), GC percent (Blue>50%, Red<50%), Newbler scaffold contigs, Celera contigs, Velvet contigs (Illumina reads only), read coverage (Combined 454 and Illumina reads sampled for 1,000 bp window. Highest coverage is 368×), minimal tiling clone pairs (shown in red), recruited reads from metagenome, taxonomic rank of top BLAST hit (yellow = Cyanobacteria, Red = others, Grey = no BLAST hit), coding regions in minus and plus strands (colored by COG functional categories). CRISPR repeat regions are highlighted in yellow in the outermost circle. Locations of genes involved in photosystems are labeled in the outermost circle.

