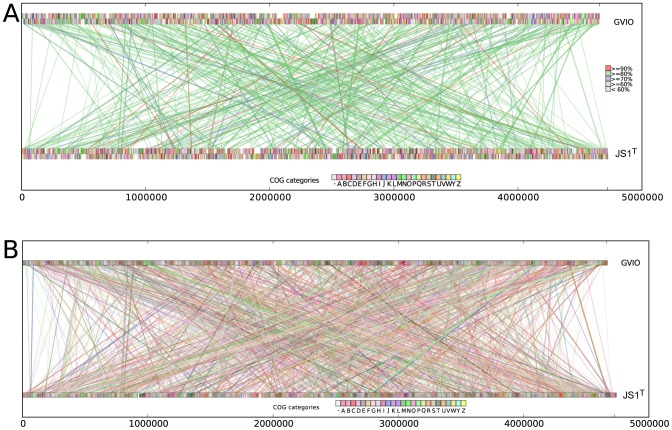
Figure 3. Comparison of gene synteny and genome rearrangements between Gloeobacter kilaueensis JS1T and Gloeobacter violaceus PCC 7421T.
(A) MUMMER alignment; colored rectangular blocks represent protein coding sequences according to COG functional categories. Lines represent matching DNA segments between the two genomes. Colors of connecting line segments are categorized according to % identities. (B) Shared orthologs identified between Gloeobacter kilaueensis JS1T and Gloeobacter violaceus PCC 7421T and their locations in the genomes. Lines connect orthologous genes and are colored according to COG functional categories. BLASTp E-values between bi-directional best hits are less than or equal to 1×10⁻⁵. Custom Python scripts were written to visualize these alignments.

