
Figure 7. Measurement of aggregation traces over time.
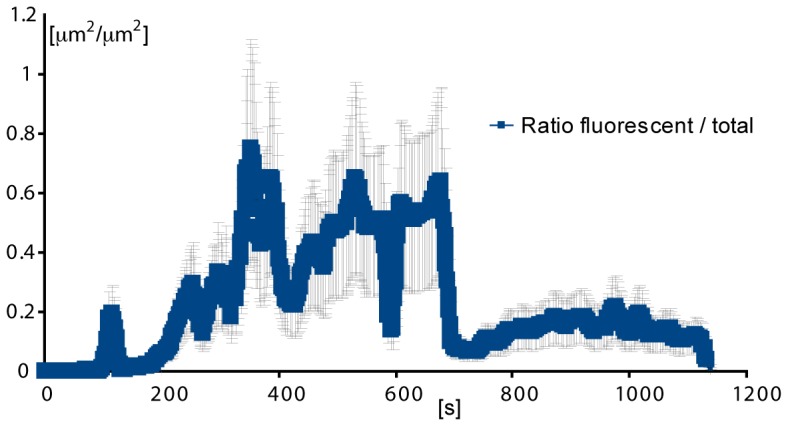
Left: Aggregate size over time. The orange trace represents the total surface area of the aggregate measured from DIC imaging. The blue trace (behind the error bars in black) represent the total surface area of the aggregate composed by fluorescent platelets. n = 3. Right: Ratio of the fluorescent surface area component over the DIC visible surface area, presented in Fig. 5d , Showing that the phenomenon of crossing streams of fluorescent platelets coming from the upper layer to the non-fluorescent bottom stream, initiated only once the developing aggregate had reached a critical surface area (left100 s), and that this phenomenon was dynamic with time. As a particular example, the size of platelet aggregate which had incorporated fluorescent platelets was comparable with the total size of aggregation at 300 and 500 seconds, but was less significant at later stages such as at 1200 seconds. 5.