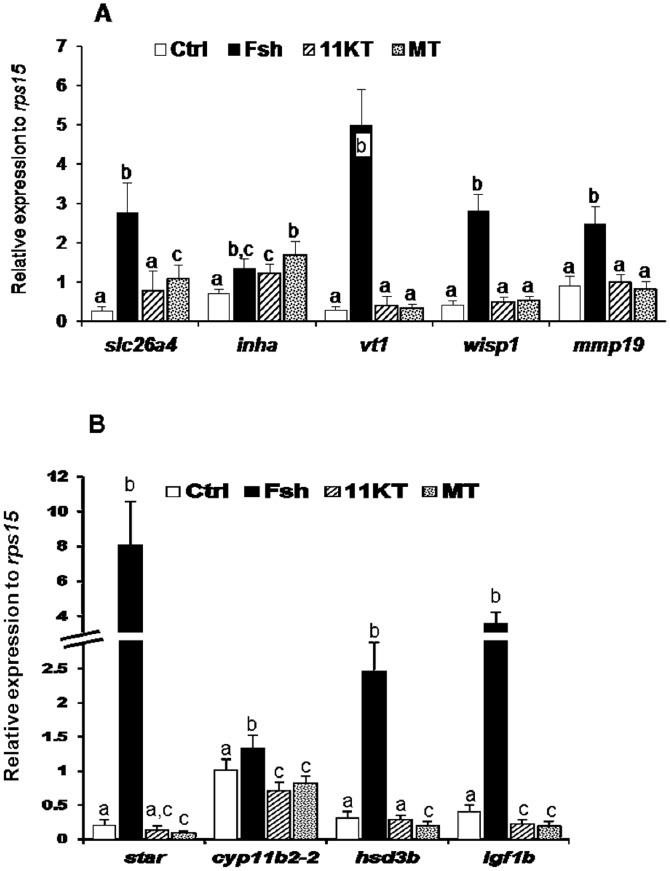
Figure 5. Real-time PCR measurement of candidate gene expression.
Relative expression of selected mRNA transcripts in testicular explants cultured during 4 days in the absence (Ctrl) or presence of either Fsh (500 ng/mL), 11-ketotestosterone (11KT) or 17α-methyltestosterone (MT) at 300 ng/mL (∼10−6 M). Bars represent mean ± SD of 5 to 6 replicates. Expression data were normalized to the reference gene rps15. Different letters indicate that treatments are significantly different as determined by non-parametric Mann & Whitney test.

