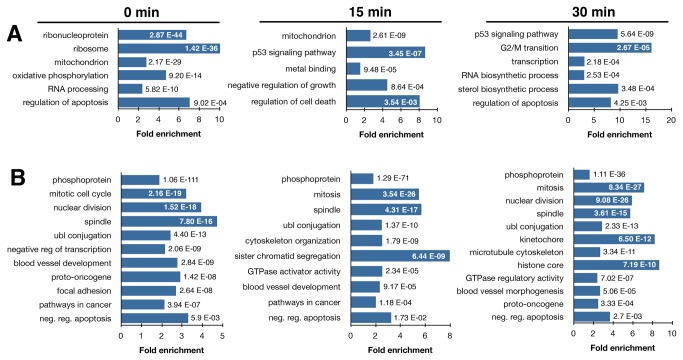
Figure 5. Pathway enrichment for genes following camptothecin treatment and reversal.
(A) Pathways represented by genes up-regulated at least 2-fold, and (B) down-regulated at least 2-fold following camptothecin treatment and recovery. Human fibroblasts were treated with 20 µM camptothecin for 45 minutes and incubated for the last 15 min with 2 mM Bru (“0 min”), incubated for 15 min with Bru following the removal of camptothecin (“15 min”) or incubated for 15 min with Bru following a 45 min treatment, a wash and a 15 min recovery (“30 min”). Enrichment analysis was performed using DAVID (david.abcc.ncifcrf.gov) and the numbers shown represents the p-values for enrichment.

