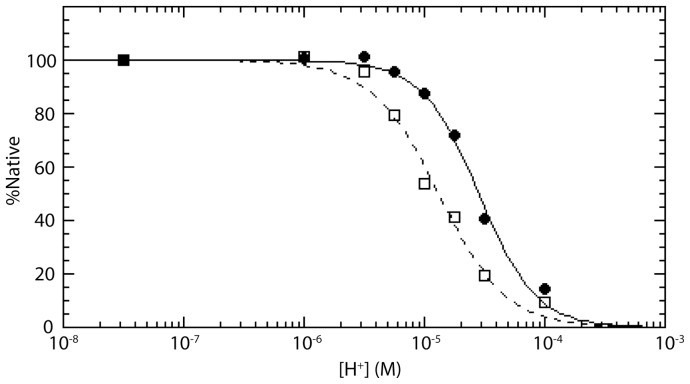
Figure 3. TBHQ stabilizes the neutral pH conformation of H7 HA.
Limited proteolysis experiment for H7 HA in the presence (open squares, dotted line) and absence (filled circles, solid line) of TBHQ at different pH. The curves correspond to fits using [H+]mp = 1.30×10⁻⁵ and n = 1.6 in the absence of TBHQ and [H+]mp = 2.83×10⁻⁵ and n = 1.8 in the presence of TBHQ (c.f. Experimental Procedures).

