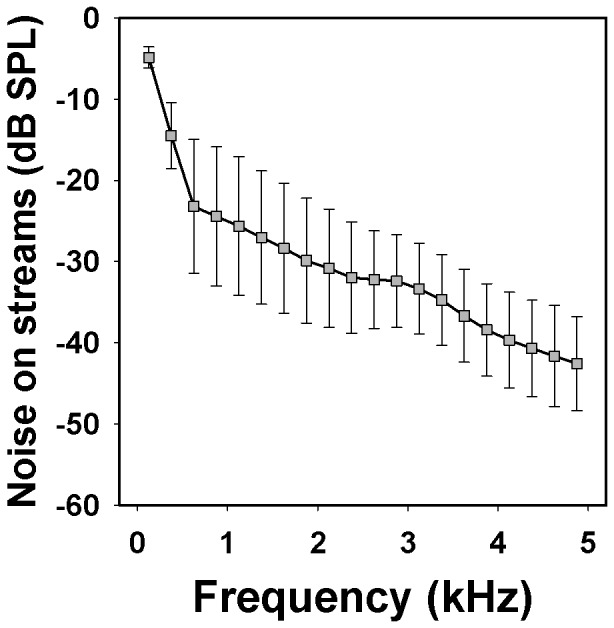
Figure 5. Power spectra of the abiotic noise on streams.

Symbols denote mean values (squares) and standard deviations based on eight recordings (Window: Blackman, DFT: 2048 samples).

Symbols denote mean values (squares) and standard deviations based on eight recordings (Window: Blackman, DFT: 2048 samples).