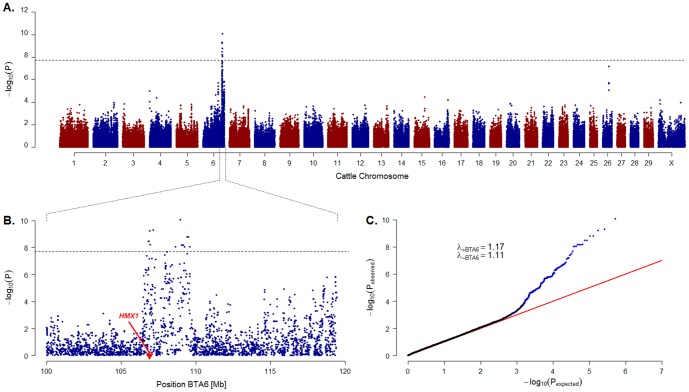
Figure 2. Results of the genome-wide association study.
(A) Manhattan-plot showing the negative decadic logarithms of the raw P values obtained from the genotypic association test (χ2 test with 2 degrees of freedom). The dashed line indicates the Bonferroni-adjusted threshold for genome-wide significance (0.01 divided by 519,828 markers). (B) Detailed view of the significantly associated region of BTA 6. The position of the HMX1 gene is highlighted in red. (C) QQ-plot reflecting the strong association signal on BTA6. The data points referring to SNPs located in the distal region of BTA6 shown in B are highlighted in blue. The genomic inflation factor λ is considerably smaller when excluding BTA 6 from the analysis (λ-BTA6) as compared to the genome-wide analysis including the chromosome (λ+BTA6).

