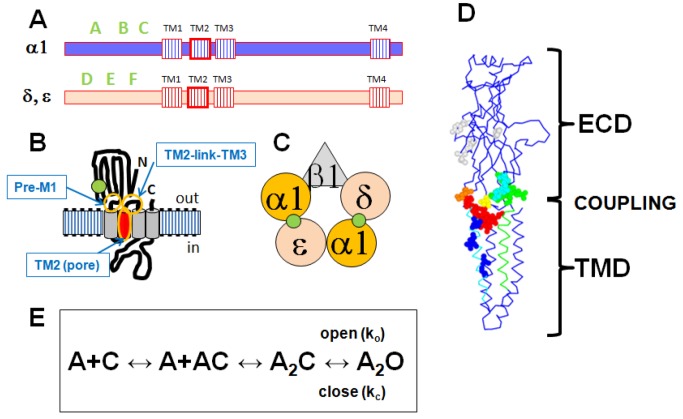
Figure 1. Schematic summaries of AChR structure.
Panel A shows the locations of relevant regions in the primary sequences. There are 4 transmembrane regions (TM1-TM4). The channel is formed by the TM2 regions (highlighted in red) from the 5 subunits. The ACh-binding loops are in the N-terminal extracellular region (loops A-C form the "principal" side, D-F the "complementary" side). Panel B shows then membrane topology of a subunit (ACh-binding site: green circle, TM2 helix red cylinder). Panel C shows the arrangement of subunits in the pentamer (viewed from the extracellular side; green circles - ACh-binding interfaces). The channel is located in the center of the rosette of subunits. Panel D shows a homology model of the mouse β1 subunit, threaded on the C. elegans GluCl E subunit [16]. The main chain is shown in blue, and the extracellular domain (ECD) and transmembrane domain (TMD) are indicated by brackets. The region coupling the ECD to the TMD is indicated by "coupling," and includes residues in the PreM1, loop 9, the TM2-link-TM3 region and the "principal pathway" (see text). In the ECD mutated residues in "loop 9" are shown in cyan, "Pre M1" in green, K46 in orange, V132 in yellow and other residues in light gray. In the TMD mutated residues in "TM2" are in blue and in the TM2-link-TM3 region in red. Many of the residues studied are located at or near the interface between the ECD and TMD regions of the subunit. Panel E shows the kinetic scheme used to interpret the data. A receptor with a closed channel (C) binds 2 molecules of agonist (A) then the channel opens (O) with an apparent opening rate ko and apparent closing rate kc.

