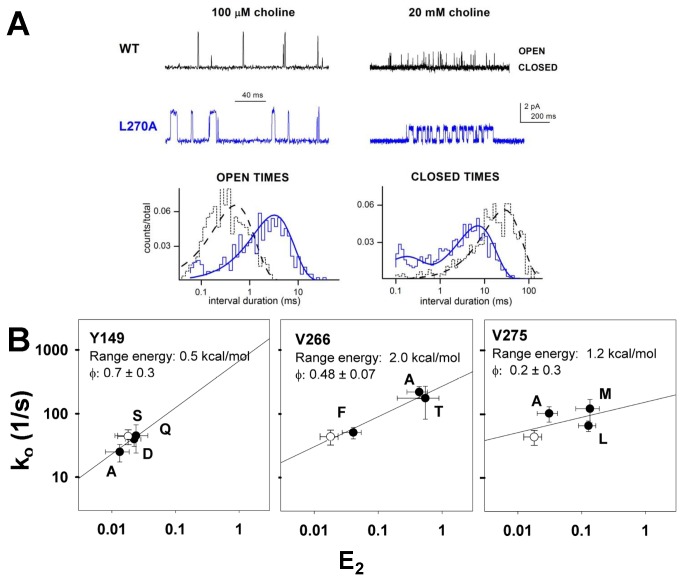
Figure 2. Rate equilibrium free energy relationships.
Panel A shows sample traces of data for wild-type receptors and receptors containing β1(L270A). On the left data at a low concentration (100 μM) of choline are shown, with histograms of the open durations shown below. The fits to the histograms were used to estimate the channel closing rate. The openings are clearly prolonged by the mutation, and the estimates for kc are 2128 s-1 for wild type and 360 s-1 for the mutant. The number of events in the histogram are 506 for β1(L270A) and 695 for wild type. On the right data at a high concentration (20 mM) are shown, with histograms of the closed durations below. The estimates for ko are 44 s-1 for wild type and 153 s-1 for the mutant (estimated from the major, slower component). The number of events in the histogram are 2390 for β1(L270A) and 2259 for wild type. Note that open channel block reduces the channel current amplitude at this high concentration. Panel B shows logarithmic plots of ko on E2 for mutations at 3 positions in the β1 subunit. The lines show the linear regression of log(ko) on log(E2). The range energy is calculated from the range of E2 values and φ is the slope of the linear regression (given as regression value ± SE of fit value). β1(Y149) illustrates a position at which the range energy is small, β1(V266) a position with a linear relationship, and β1(V275) a position at which the slope of the line is poorly defined. The hollow symbol shows data for wild-type receptors. Data points are identified with the residue at the position, and are mean ± SE. Rate-equilibrium plots for all positions are shown in Figure S2.

