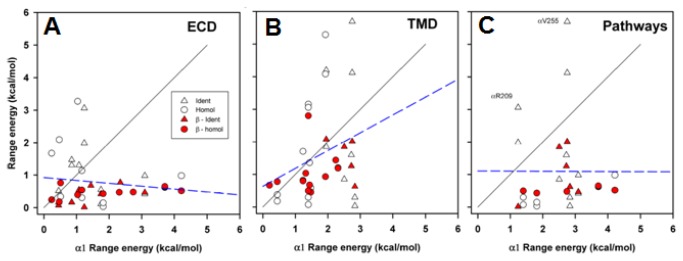
Figure 6. Range energies at homologous positions.

Scatter plots for range energy are shown for positions in the β1, δ or ε subunits (ordinate) plotted against the value for the homologous position in α1 (abscissa). All data shown in Figure 3 are plotted. The regions shown are ECD (β1(V46) to K221), TMD (β1(S257) to I286) and Pathways (see Text, β1(E45), K46, N96, S127, Y149, R220, V266, P276, S279, L280 and P283). Two positions are identified by their locations in the α1 subunit, that have large range energies in the complementary face subunits (δ and ε) but lower values in the β1 subunit. Positions at which all 4 subunits have the same amino acid are shown by triangles, while positions at which one or more differ are shown by circles. Data for the β1 subunit are shown as filled red symbols. The solid lines show the line of equality, the dashed lines show the regression lines (no slope differed significantly from 0).
