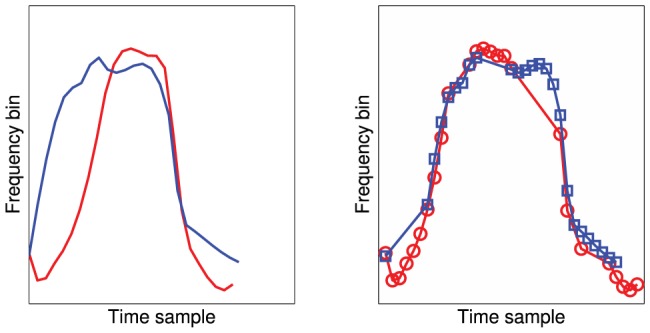
Figure 2. An example of the dynamic time-warping matching of two whistle profiles.

The left frame shows the original signals on arbitrary time and frequency axes. The right frame shows the red sample having undergone a dynamic time-warping transformation to produce the minimum least-squares distance from the blue sample. Note how the spacing of the points in the curve have been varied.
