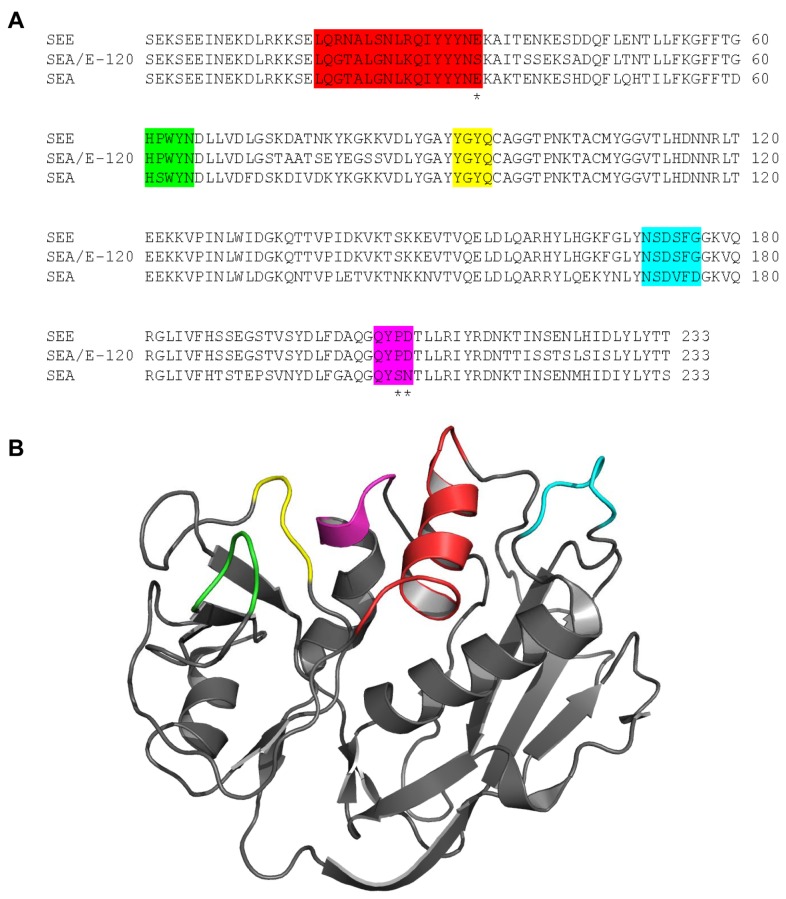
Figure 2. Sequences and structure of Sags show putative TCR binding regions on SEA, SEE and SEA/E-120.
A) Sequence alignment of the SEA/E-120, SEA and SEE. Residues in the presumed TCR binding site are colored. Residues believed to be of particular importance for TCRVβ binding are marked with asterisks. B) Putative TCR binding residues are mapped onto the SEA structure (PDB ID: 1lo5) and marked in accordance with the coloring in A.

