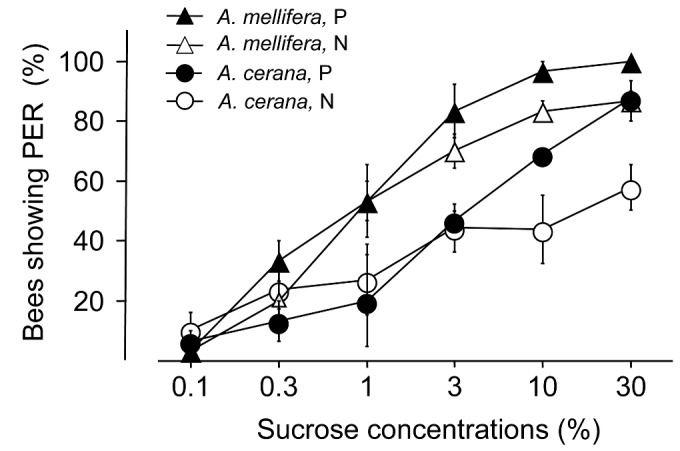
Figure 2. Percentage of bees showing proboscis extension response (mean+SE) of pollen (P, solid) and nectar (N, empty) foragers of Apis mellifera (triangles) and A. cerana (circles) of unknown-aged foragers in mixed-species colonies, across different sucrose concentrations (plotted as log scale but with actual concentrations).

Data based on 3 mixed-species colonies (N = 3 x 2 x 2 x 10 = 120 bees).
