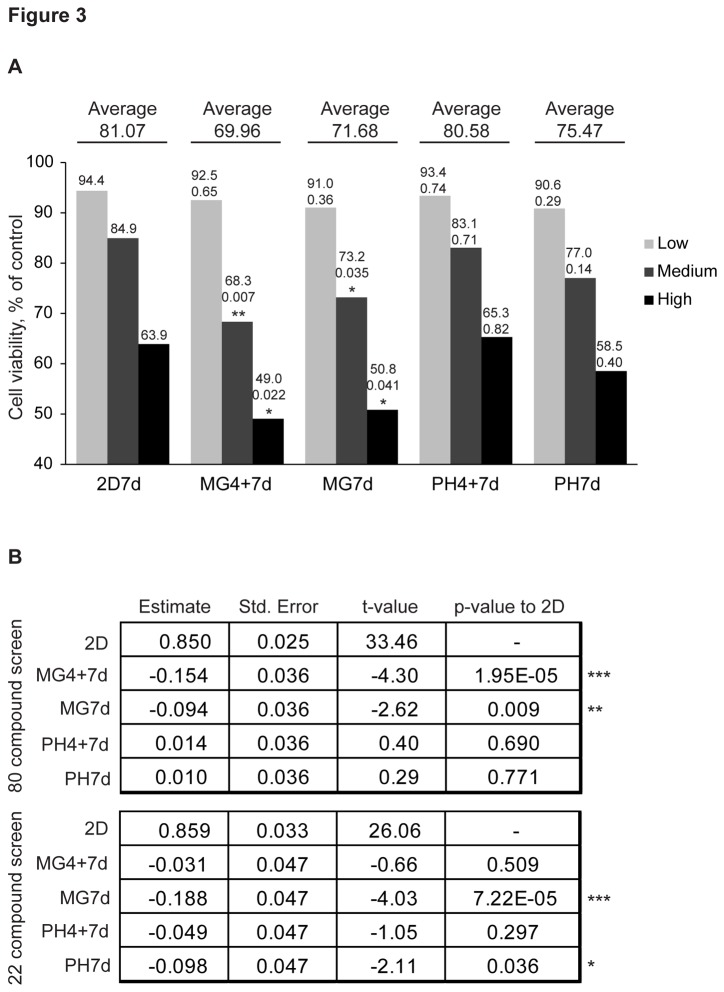
Figure 3. JIMT1 cells are more sensitive to drugs in Matrigel.
A. Average drug response of the JIMT1 cells in different cell culture models. The average responses of the 63 drugs are shown individually for the three highest concentrations (high (0.34-20 µM), medium (0.034-2 µM), and low (0.0034-0.2 µM) and across the concentrations. Response, p-value, and significance (** < 0.01, * < 0.05) compared to 2D are shown above the bars and average across the concentrations is shown above the line. Drug annotations and concentrations used for each drug are shown in File S1. B. Multiple linear regression analysis of individual drug screens comparing general drug effects to 2D. T-value shows the response difference to 2D (33.46 or 26.06). ***< 0.001, **<0.01, *<0.05.

