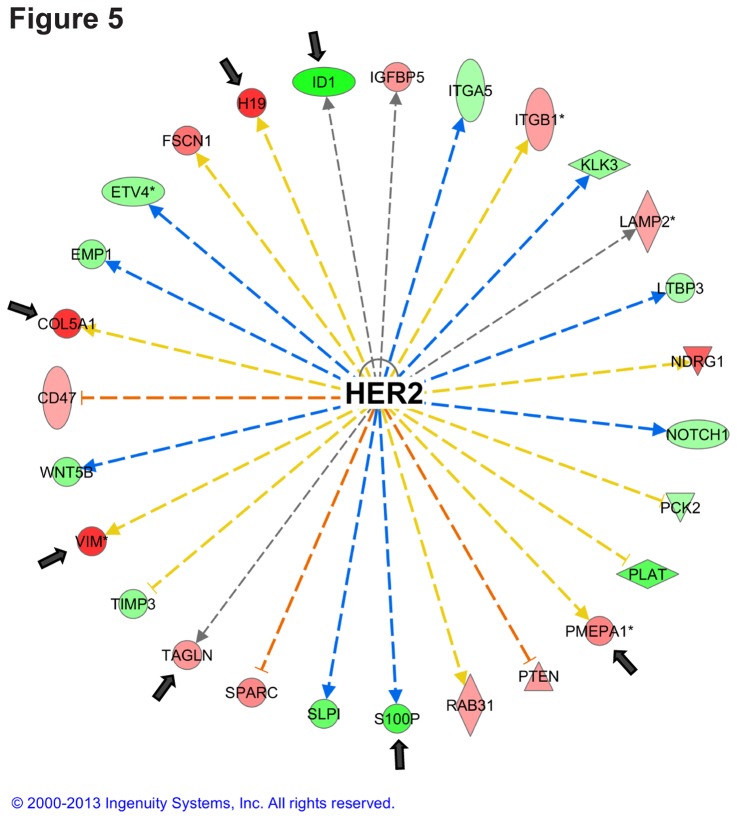
Figure 5. HER2 signaling is altered in xenograft.
The most significantly altered upstream regulator in xenograft compared to 2D according to IPA; the HER2 pathway with arrows pointing to the top five changing genes shown in Table 1. Genes in red were upregulated in xenografts, and genes in green were downregulated. The 200 most upregulated and the 200 most downregulated genes in the xenografts compared to the 2D cultures were subjected to IPA analysis using the log-fold differences in expression as comparison values.

