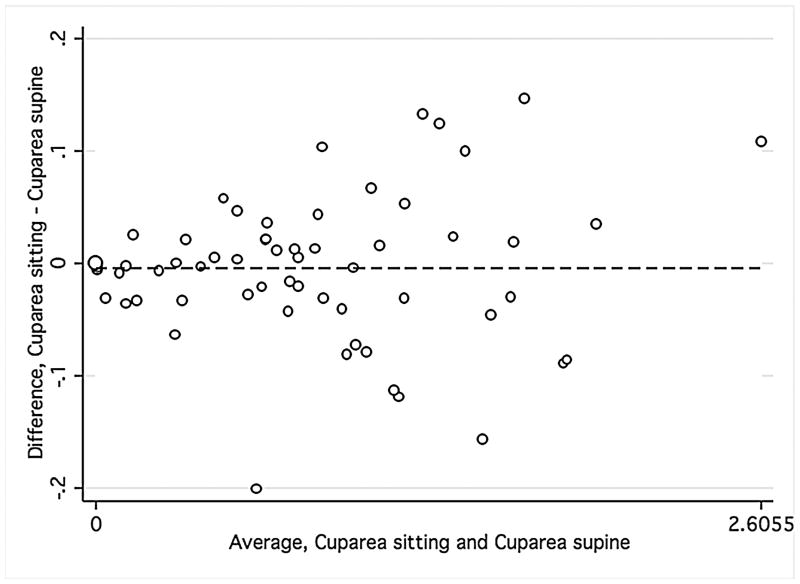
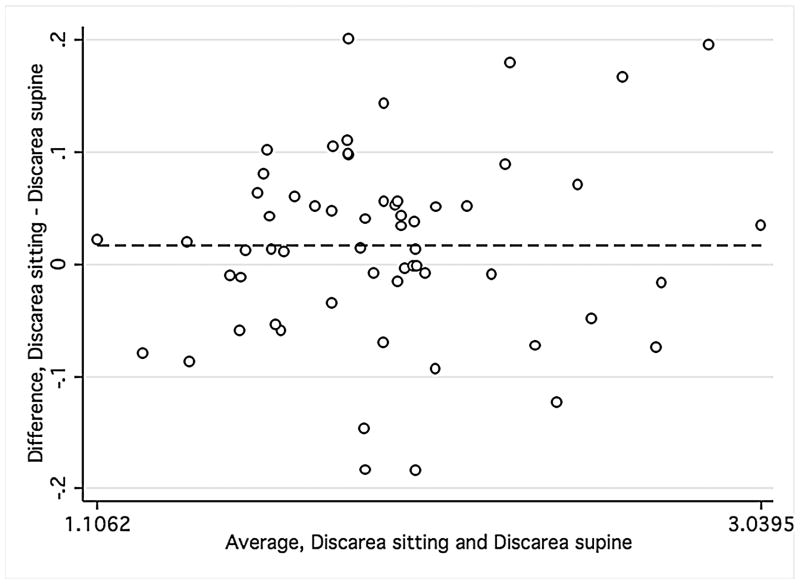
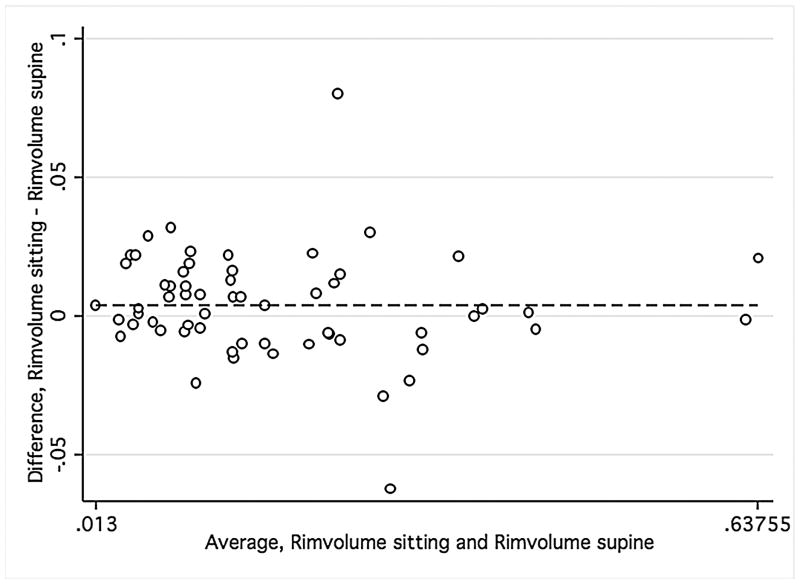
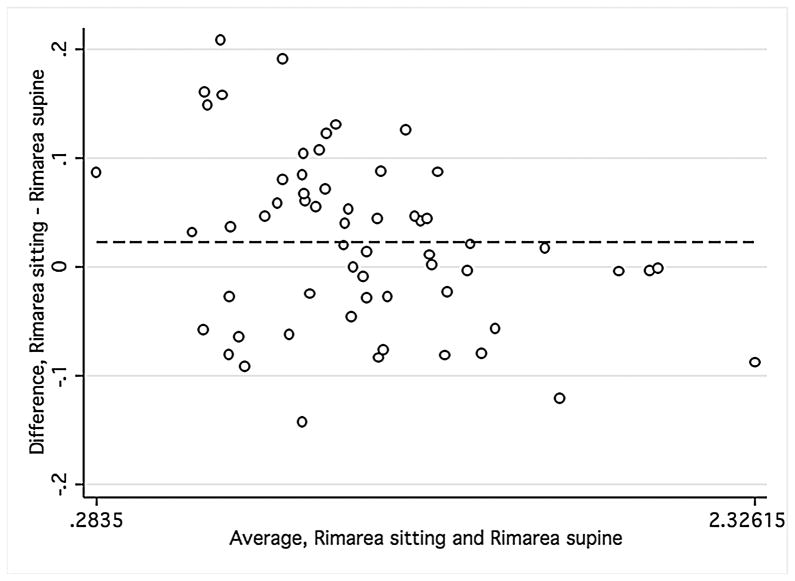
FIGURE 1.
Bland-Altman plots showing the agreement of optic nerve head measurements between the supine and sitting position in the combined group of young healthy subjects, older healthy subjects, and glaucoma patients.
Footnote: Cup area (Mean difference = −.005, Limits of agreement;−.13, .13) (1 Top left), disc area (Mean difference = .017, Limits of agreement; −.15, .18) (2 Top right), rim volume (Mean difference = .004, Limits of agreement;−.03,.04) (3 Bottom right), and rim area (Mean difference = .02, Limits of agreement;−.13, .18) (4 Bottom left). Variability is consistent for cup area (r = 0.12; P = 0.37), disc area (r = −0.12; P = 0.38), and rim volume (r = −0.11; P = 0.43) but not rim area (r = −0.34; P = 0.01).


