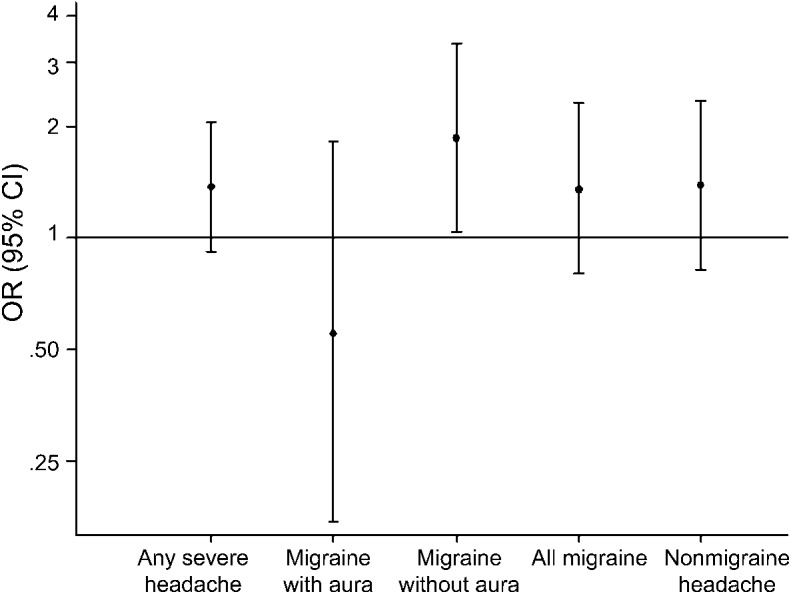
Figure 2. Adjusted odds ratios for having a categorical white matter hyperintensity score ≥3 at visit 3 (1993–1995) by headache status.

Each headache subgroup is compared with the “no severe headache” group as the referent. Dots represent the odds ratios (ORs) with bars representing the 95% confidence intervals (CIs).
