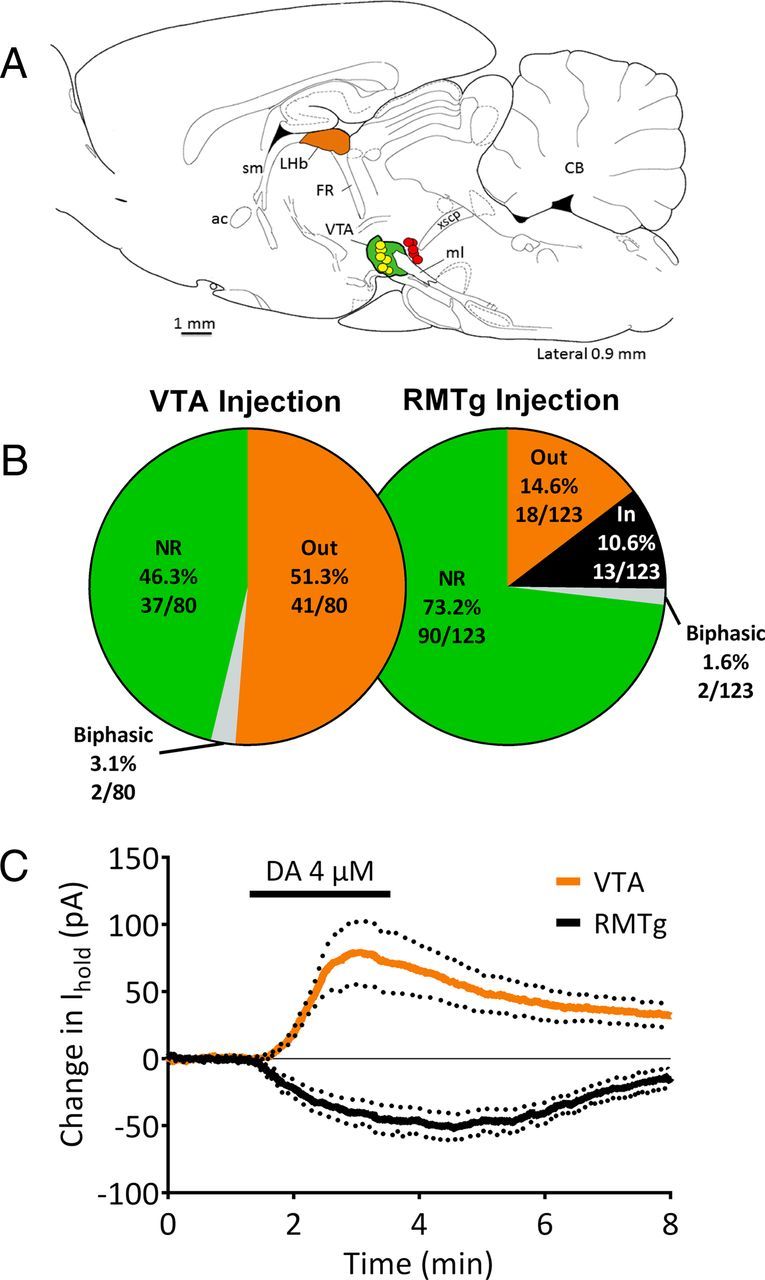
Figure 8.

Responses to DA in mLHb neurons labeled with retrograde fluorescent markers. A, Composite diagram indicating the locations of representative Neuro-DiI or CTB retrograde tracer injections into the VTA or RMTg regions (caudal to VTA) of the ventral midbrain (see Materials and Methods for VTA and RMTg injection coordinates). The locations of tracer found upon histological examination for injections targeting the VTA are shown in yellow (n = 5 rats), and those targeting the RMTg are shown in red (n = 4 rats). The VTA region is colored in green. Whole-cell recordings were then made in tracer-containing neurons located in the medial portion of the LHb (orange) using epifluorescence microscopy in brain slices. The figure is modified from the electronic rat brain atlas of Paxinos and Watson, (1998). B, The distribution of responses to DA in retrogradely labeled mLHb neurons following VTA or RMTg injections of fluorescent dyes. NR, No response to DA; Out, outward hyperpolarizing current; In, inward depolarizing current; biphasic, cells demonstrating initial outward currents followed by inward currents. C, Mean outward currents recorded in mLHb neurons (n = 14) labeled by VTA dye injections (orange line), and mean inward currents recorded in mLHb neurons labeled by RMTg (n = 12) dye injections (black line) during DA application in subpopulation of responsive LHb neurons. DA (4 μm) was applied as indicated by the black bar, and dotted lines indicate the SEM. sm, Stria medullaris; ac, anterior commissure; FR, fasciculus retroflexus; ml, medial lemniscus; xscp, decussation of the superior cerebellar peduncle; CB, cerebellum.
