
Figure 3.
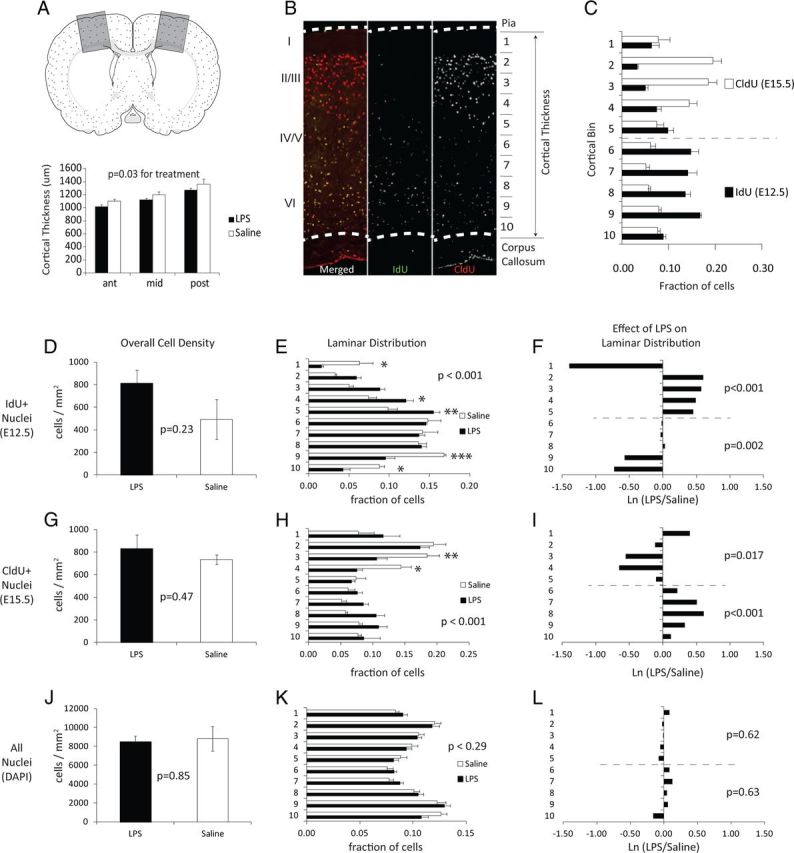
Cellularity and cellular birthdates in the cortex of adult offspring. Pregnant mice were treated with saline or LPS (60 μg/kg) at E12.5. At birth, offspring were fostered to naive mothers, and brains of offspring were harvested at P28. A, A schematic drawing of a mouse coronal brain section showing boxed areas of somatosensory and motor cortex that were evaluated in these studies. Cortical thickness was measured in P28 mice as the distance between pia and CC in three semiserial sections (960 μm intervals), beginning at the head of the dorsal lateral ventricles and extending caudally to approximately the hippocampal commissure. Cortical areas were sampled at ∼1 mm lateral from the midline. Mice from the LPS treatment group showed a decrease in cortical thickness (*p = 0.03 effect of treatment, two-way ANOVA, n = 5 from 3 pregnancies). B, An example adult cortex stained for IdU-positive cells generated at E12.5 (green) and CldU-positive cells generated at E15.5 (red). Also shown are the relative positions of major cortical lamina and the division of the cortex into 10 equal bins for positional scoring of cell location. Bin 1 is located in superficial layer I of the cortex and bin 10 is located in the ventral-most region of layer VI. C, Fraction of IdU- and CldU-positive cells located in each laminar bin shows the normal segregation of E12.5-born cells to bins 6–10 and E15.5-born cells to bins 1–5 in saline controls. D, The density of IdU+ cells in all lamina (p = 0.23, two-tailed Student's t test, n = 4). E, The laminar distribution of IdU+ cells in saline or LPS treatment groups (n = 4), p value for treatment is shown and Bonferroni post hoc significance indicated by *p < 0.05, **p < 0.01, and ***p < 0.001. F, The relative LPS-induced change in distribution calculated as the Ln(LPS/Saline) for values shown in E. The p values are listed for treatment effects calculated separately for bins 6–10 and 1–5, corresponding to the laminar bins containing the majority of cells labeled during the inflammatory challenge at E12.5 (bins 6–10) or 3 d after the inflammatory challenge at E15.5 (bins 1–5). G–I, The density and laminar distribution of CldU-positive cells. J–L, The density and laminar distribution of all nuclei within the cortex. Complete two-way ANOVA values for cell density and relative laminar distribution are provided in Tables 1 and 2, respectively.