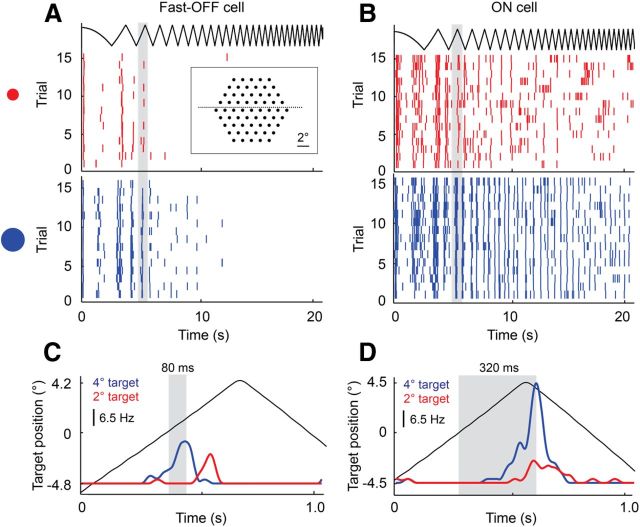
Figure 1.
Temporal response of single ganglion cells to target motion of different sizes and speeds. A target moved alternately left and right at linearly increasing speeds from 0 to 50 °/s. A, B, Spike rasters of a fast-OFF cell and an ON cell, respectively, for 15 repetitions of the trajectory for a small (red) and a large (blue) target moving across the electrode array (inset). C, Zoom of gray region in A, showing the average firing rate of the fast-OFF cell as the target passed through its receptive field. D, Zoom of gray region in B, showing the average firing rate of the ON cell as the target passed through its receptive field. Gray regions in C and D mark the latency from when the center of the target was aligned with the center of the receptive field to the peak of the subsequent fast-OFF and ON cell responses. For a 4° dark target moving at ∼10°/s, fast-OFF cells report the moment when the target crosses the receptive field center about four times faster than ON cells.

