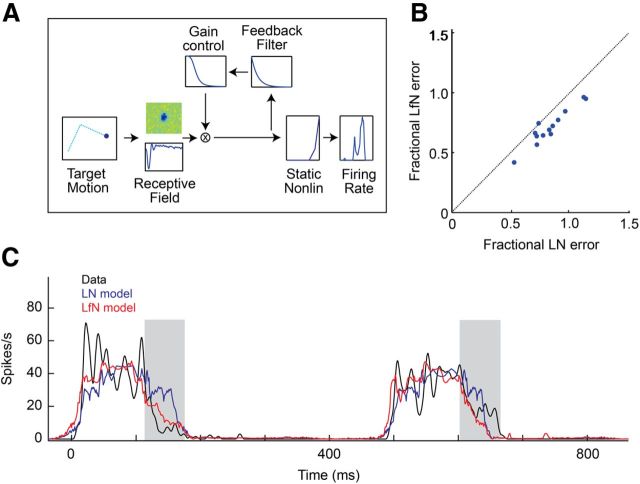
Figure 2.
The LfN model accurately describes fast-OFF ganglion cell responses to small target motion. A, Three-stage LfN cascade model for fast-OFF ganglion cell responses to small target motion. Two-dimensional target motion is passed through a linear spatiotemporal filter (the receptive field) followed by a contrast gain control loop. A static nonlinearity converts this generator potential into spike rates. LN models contain the linear filter and static nonlinearly but lack the feedback loop. B, Comparison of LN and LfN descriptive power. The fractional RMS error is the ratio between the RMS error of the model prediction from mean rate data to the single-trial variability; it expresses the accuracy of the model fit relative to intrinsic cell variability. C, Mean firing rate time series (black) for a single fast-OFF ganglion cell to naturalistic motion is compared to predicted firing rates from an LN (blue) and LfN (red) model. While both the LN and LfN models captured the times when the cell's firing rate changes, the LfN model provided a more accurate description of the kinetics of each response, particularly the trailing component of each burst (gray bars).

