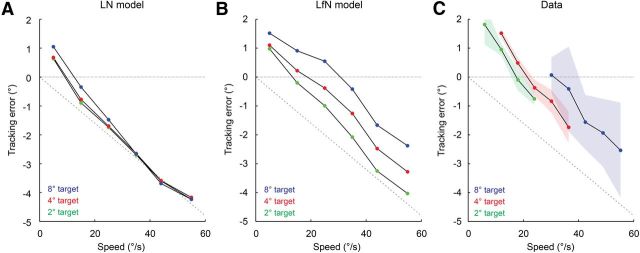
Figure 8.
Errors in PVA estimates of target location as a function of network type, and target size and speed. A, Tracking for LN network shown in Figure 6, A and B. B, Tracking for LfN network shown in Figure 6, C and D. C, Tracking for fast-OFF cell population data shown in Figure 6E. Solid lines are derived from trial-averaged data, shaded regions show the ±1 SD contours from single trials, for each target size. A coverage factor of 2.5 was used. The latency of the cells used in the model and in the data was 80 ms. The gray dashed line shows the linear increase in tracking error that would occur for a network with a fixed 80 ms delay and no other dynamics.

