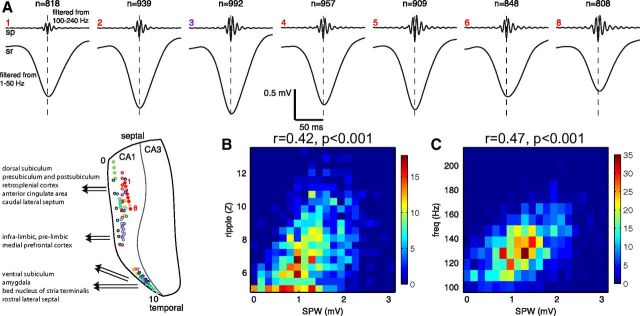
Figure 1.
Sharp waves and ripples in the CA1 region. A, Ripples and sharp waves recorded from seven pairs of sites (red dots in inset) in the pyramidal layer (sp) and middle of stratum radiatum (sr) along the septotemporal axis. Each pair is an independent average of >807 (actual number given on top of each shank) events, triggered by the trough of the largest amplitude ripple wave of the locally recorded ripple events. Flat map shows the location of the recording electrodes in the CA1 region. B, Correlation between the peak amplitude of sharp waves and ripple magnitude (root mean square of the filtered event) measured between sites in the pyramidal layer and radiatum on shank 3 (A, purple dot). Colors indicate the density of points. C, Correlation between the peak amplitude of sharp waves and ripple frequency (using same data as in B). sp, stratum pyramidale; sr, stratum radiatum.

