Figure 3.
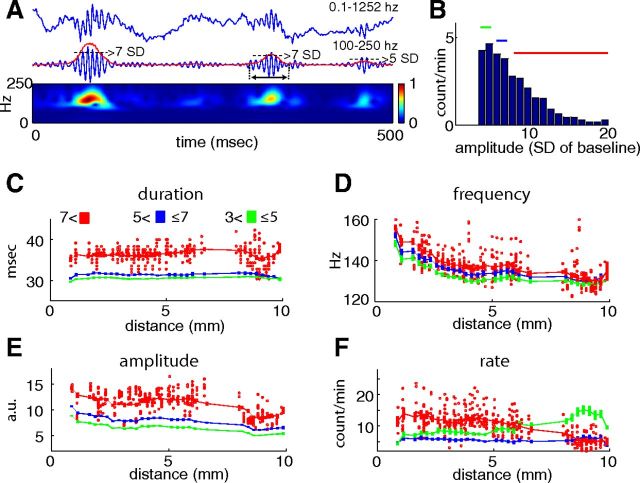
Parameters of ripples. A, Three successive ripple events and their filtered derivatives. The red line represents the root mean square (magnitude) of the ripple events. Dotted lines illustrate ripple events >7 and >5 SDs above the session mean baseline. The duration of the ripple event is determined as the interval where the magnitude exceeds and goes below 1.5 SD (double arrow under the second ripple). Bottom, Morlet wavelet decomposition of the events. B, Amplitude distribution of ripple events from an example session at a septal CA1 location. Color lines indicate 3–5 SD (green), 5–7 SD (blue), and >7 SD (red) events. C–F, Group data for duration, frequency, amplitude, and rate of ripple events. Each red dot is a session mean of ripple events recorded by a given electrode. In each graph, the x-axis provides the location of the electrodes along the septotemporal axis, from the septal pole (0 mm) to the temporal pole (10 mm). The red line represents the running average (pooled across sessions and rats) for >7 SD ripple events. For the smaller-amplitude events (3–5 and 5–7 SDs), only the running averages are shown.

